

|
The Average log enables you to get data from the controller on such general parameters of the wind turbine operation as outdoor temperature, rotor and generator rotational speeds, oil pressure in the gearbox, controller idle time, etc.
There are two types of the Average log in MiScout SCADA - Vendor and SCADA:
In order to generate Vendor Standard Average Log in MiScout SCADA Desk, take the steps as described in the following workaround.
As soon as you reach the Operational Logs toolbar, you can take all the necessary steps for generating Vendor Average Log.
1. Click the New icon available in the Window section of the toolbar to open the Operational Logs Browser window.
2. Afterwards, select the appropriate controller in the Controller View panel to the left of the main window.

3. Next, click the ![]() Vendor icon on the main toolbar.
Vendor icon on the main toolbar.
As a result, the Communication Log will show appropriate messages ensuring that communication with the selected controller has been established. Besides, the Channels panel will appear to the right displaying a list of channels available for this log type.
4. Specify required channels you'd like to see in the log by selecting corresponding check-boxes.
Important Note. 64 channels is the maximum number of items allowed to be selected at a time for log generation. Therefore, try to select 64 items or less in the Channels panel at a time.
Additionally, Filter mask can be used for a comfortable and quick search for the required channels based on the channel name. To view the selected channels, select the Checked Only check-box.
5. To proceed, specify the time period for the log to be generated using desirable tools provided by the Time selector.
When generating Vendor Standard Average Log for the first time, Original will be assigned as a default aggregation period for the log. After first successful generation of the log all data will be stored into the database. So that further on, a user will be able to select other aggregation periods in the Time selector.
Note. Value for the aggregation period meant by Original depends on the controller type (i.e. 5 min. - for Mita Controllers, 10 min. - for VMP and TAC Controllers, etc.).
6. Eventually, press the Start button to launch the log generation process.
Finally, Vendor Standard Average Log will be shown in Operational Log Browser window.
Generally speaking, logs display graphical or numerical presentation of the selected parameters over a definite time period, which a user has prior specified. The logs data can be presented in two modes - Chart and Grid. You can easily switch between the data presentation modes by clicking the corresponding icons.

In the meantime, Chart is used as a default mode. Therefore, as soon as the log is ready, the Data window in the Chart view appears giving a graphical presentation of the Vendor Standard Average Log data.
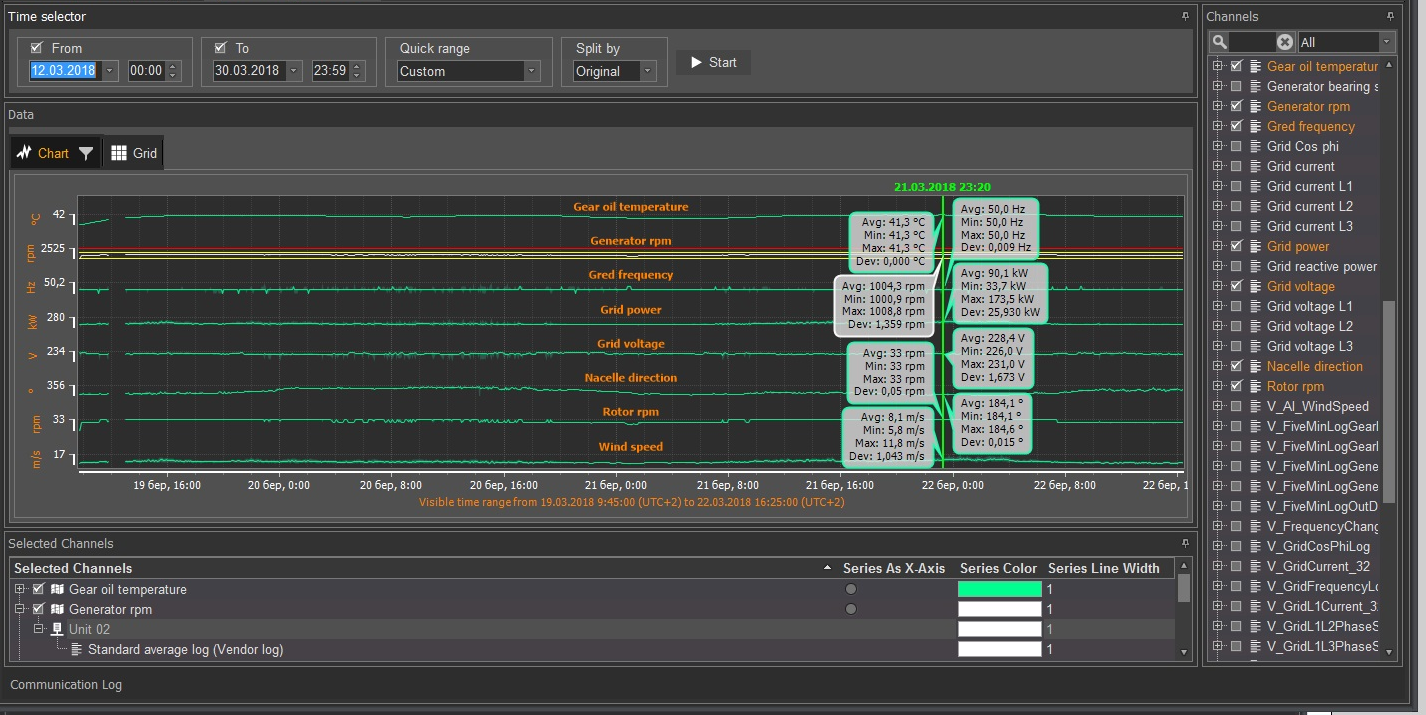
The Selected Channels section provides a possibility to customize the Chart appearance. You can adjust the desired look by setting the following parameters:
To zoom in the required part of the graph make a selection with the cursor in the direction from the left to the right, and zoom in several times thus enlarging the picture more and more. To zoom out, you should make a selection in the opposite direction - from the right to the left. Zooming out is performed just once and returns the window view to its original scale.
Please pay attention to the following options on the toolbar:
Vendor Standard Average log in a Grid view presents numerical data for selected channels and controllers. The Grid consists of several columns depending on the quantity of the selected Channels as well as parameters selected in the Show/Hide section. The first column Timestamp displays date and time, whereas rest columns contain data according to the selected channels.
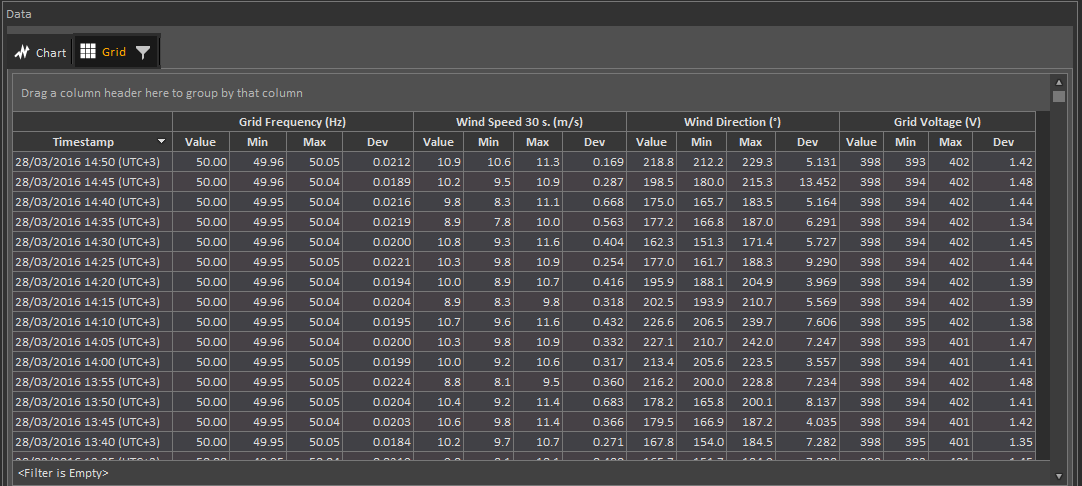
Each of the displayed channels in the grid may contain 4 columns named as follows:
The following sub-columns will appear in the grid in case the appropriate Show Span and Show Deviation check-boxes have been prior selected by a user as well as the appropriate data are currently available on controller:
The channels in each grid column can be sorted by name or by values in a descending or ascending order by pressing the column caption. As soon as you click the column caption, a gray downward or upward arrow icon appears, so that:
Besides, MiScout Desk allows to filter channels in each columns of the grid using the  filter icon found next to the column name. So, all you need, is to select the required options in the revealed drop-down menu.
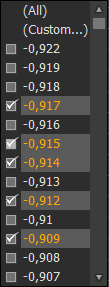
You can also configure a grid filter by clicking the Customize...
 icon.
icon.
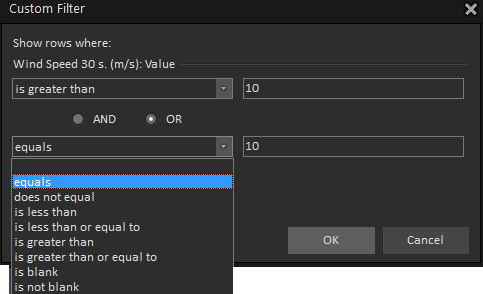
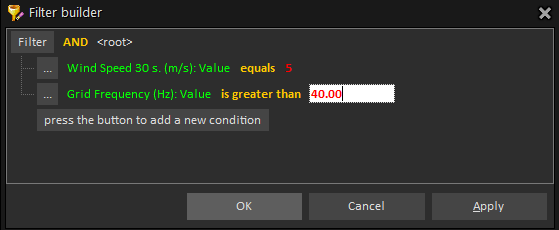
Upon clicking the ![]() Filter builder icon you can easily customize the process of filtering by setting the required parameters and conditions.
Filter builder icon you can easily customize the process of filtering by setting the required parameters and conditions.
For user's convenience, all controller data shown in the Operational Logs tab can be viewed and saved as an Excel (.xls) file. This can be done with the help of the ![]() Open in Excel and Save to Excel
Open in Excel and Save to Excel![]() icons residing in the Export section of the Operational Logs toolbar.
icons residing in the Export section of the Operational Logs toolbar.
Therefore, upon clicking ![]() , the log data will appear in the revealed Excel file (.xls).
, the log data will appear in the revealed Excel file (.xls).
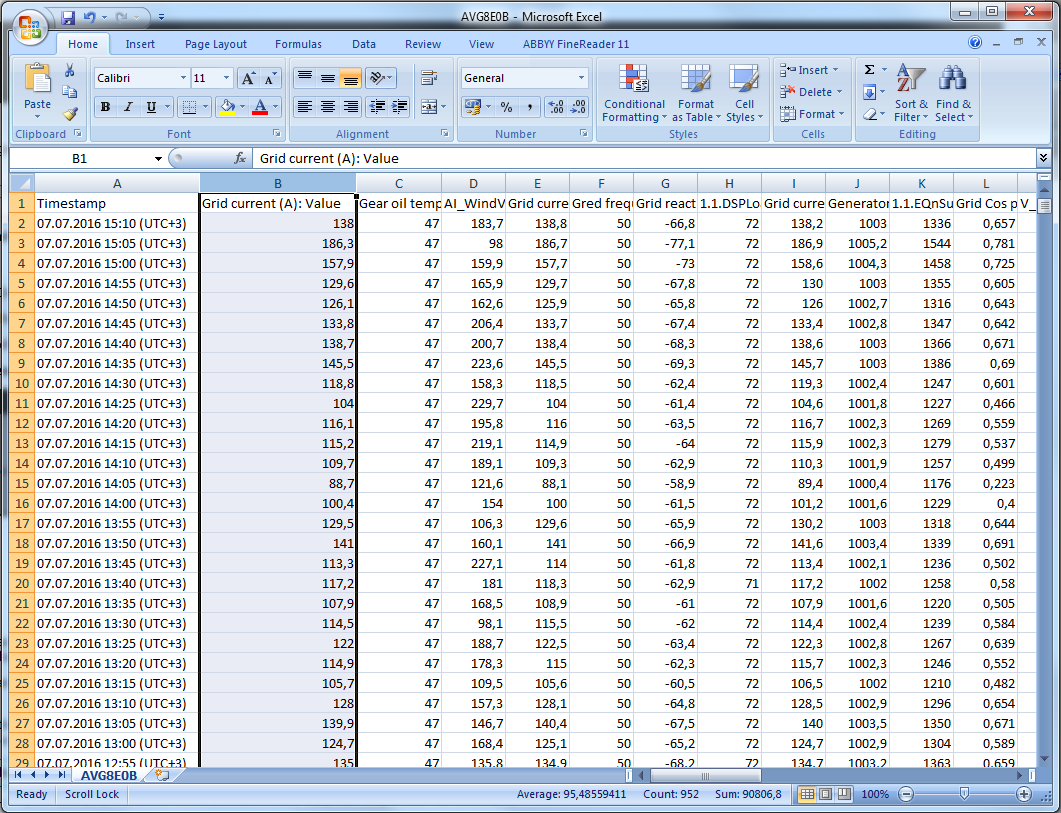
Please note, that on clicking the ![]() Open in Excel icon, the revealed Excel file (.xls) is available for viewing only. By default, this file is saved to the temporary directory, so that it won't be available after a user has logged out.
Open in Excel icon, the revealed Excel file (.xls) is available for viewing only. By default, this file is saved to the temporary directory, so that it won't be available after a user has logged out.
To be able to use the excel file after logging out from ![]() icon to save the file for further use. As a result, the Save As dialog appears on the screen allowing to select the destination folder, into which the Excel file will be stored.
icon to save the file for further use. As a result, the Save As dialog appears on the screen allowing to select the destination folder, into which the Excel file will be stored.
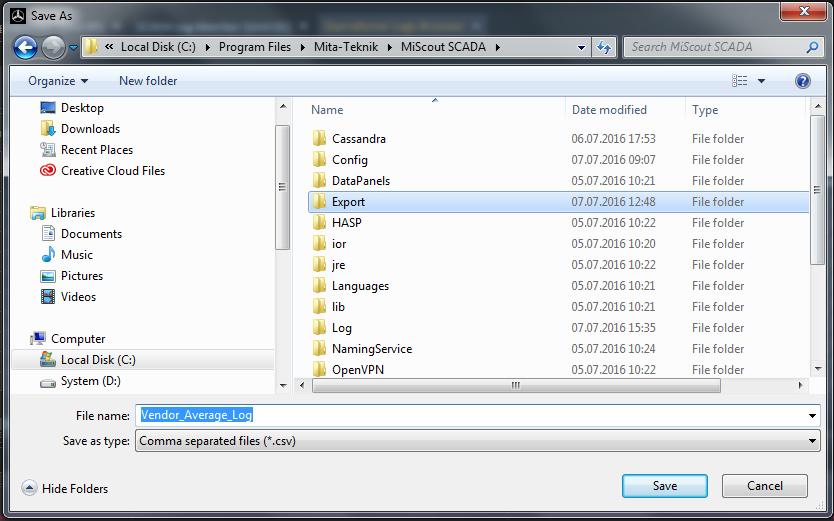
In the File name field: specify the name for the .xls file and select Comma separated files (.csv) in the Save as type: field. Finally, press the Save button to finalize the configuration process. If done successfully, the newly created Excel file will be available in the corresponding directory.
