|
|
In the Status log a new entry is made when a status code is set; when status code is being cleared, an update of the previously logged in data is made, so that each log line holds information on both status code setting and clear time stamps.
There are two types of the Status Log in MiScout SCADA - Vendor and SCADA, each described in more detail further in this chapter.
To enable SCADA Status Log monitoring, please, select the corresponding script (livedata\StatusCode.js) in the Action Properties section of Edit Threshold while configuring a threshold. For more detail information, see Configuring Thresholds for SCADA Logs monitoring and the Scripts View section.
In order to generate Vendor Status Log in MiScout SCADA Desk, take the steps as described in the following workaround.
As soon as you reach the Operational Logs toolbar, you can take all the necessary steps for generating the log.
1. Click the New icon available in the Window section of the toolbar to open the Operational Logs Browser window.
2. Afterwards, select the appropriate controller in the Controller View panel to the left of the main window.

3. Next, click the Vendor or SCADA icon in the Status Log section on the main toolbar.
As a result, the Communication Log will show appropriate messages ensuring that communication with the selected controller has been established.
4. To proceed, specify the time period for the log to be generated using desirable tools provided by the Time selector.
5. Eventually, press the Start button to launch the log generation process.
Finally, Vendor Status Log will be shown in the Operational Logs Browser.
Generally speaking, logs display graphical or numerical presentation of the selected parameters over a definite time period, which a user has prior specified. The logs data can be presented in two modes - Chart and Grid. You can easily switch between the data presentation modes by clicking the corresponding icons.
The Data window in the Chart view graphically represents Status Codes data.

The Y-axis of the chart displays all status codes which have been active over the selected time period. Whereas, the X-axis shows the time period prior selected for the Status Log generation. Consequently, horizontal color bars on the chart show duration of the status code activation period. Thus, the beginning of the graphical bar marks the time the status code is set; while the bar end marks the status code clear (i.e. reset) timestamp. Depending on how long the status code has been active, the chart may represent either a long graphical bar or merely one color dot. The color dot means, that the time period during which the status code has been active is extremely short and can be measured in seconds or milliseconds.
The Selected Channels section provides a possibility to customize the Chart appearance. You can adjust the desired look by setting the following parameters: enable Series As X-axis; pick Series Color in the drop-down menu, set Series Line Width and choose Series Type for each channel.
To zoom in the required part of the graph make a selection with the cursor in the direction from the left to the right, and zoom in several times thus enlarging the picture more and more. To zoom out, you should make a selection in the opposite direction - from the right to the left. Zooming out is performed just once and returns the window view to its original scale.
The Grid view gives a numerical presentation of the Status Codes data.
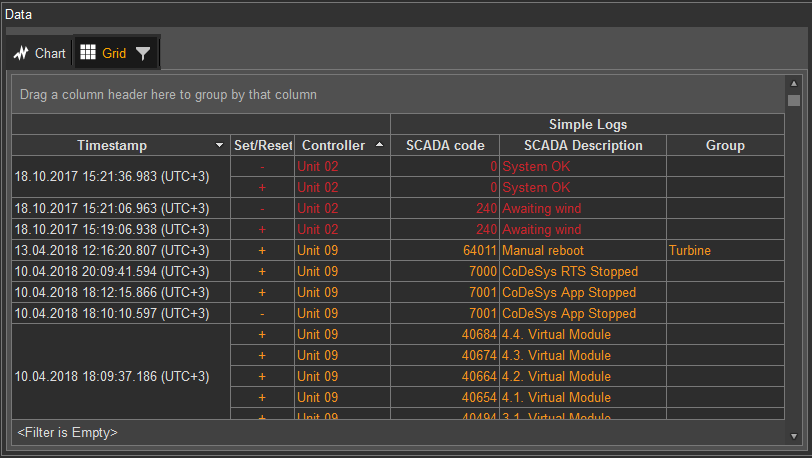
The Data window in the Grid view consists of four columns informing you on the following parameters:
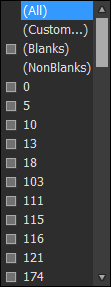
MiScout Desk allows to filter status codes in each column of the grid using the  Filter icon found next to the column name. So, all you need, is to select the required options in the revealed drop-down menu.
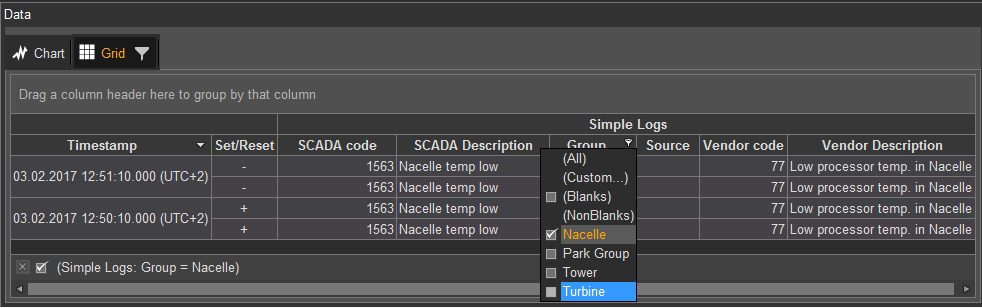
Therefore, in this way status code groups can be filtered in the corresponding Group column of the grid. All yo need is to select the check-box next to the required group name and data in the grid will be filtered accordingly.
You can also configure a grid filter by clicking the Customize...  icon.
icon.
Upon clicking the  Filter icon you can easily customize the process of filtering by setting the required parameters and conditions.

Viewing and saving log data as an Excel (.xls) file
For user's convenience, all controller data shown in the Operational Logs Browser can be viewed and saved as an Excel (.xls) file. For more detail instructions, refer to Viewing and saving log data as an Excel (.xls) file described in Vendor Standard Average Log.