Data Sets Setup
Data Set Manager is the functionality in MiScout SCADA allowing a user to create and edit data sets, data items and thresholds. The data sets, in turn, allow arranging the data items (i.e. data classes) into groups which can be used for data presentation and calculation. For the most part, this is done for user's convenience allowing to limit the amount of data presented either on the dashboard in MiScout Web or on data panels in Screen Designer.
To be able to use Data Set Manager, the Data Set Manager(mtplDataSetManager.bpl) plug-in is required. Therefore, first of all, make sure that it is already listed in the Plugin Configuration dialog.
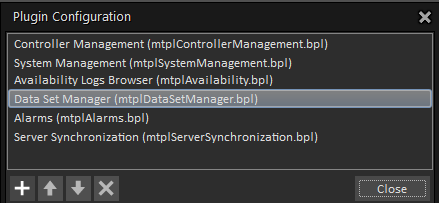
For more detail information, refer to Configuring Plug-ins.
Data Set Manager interface
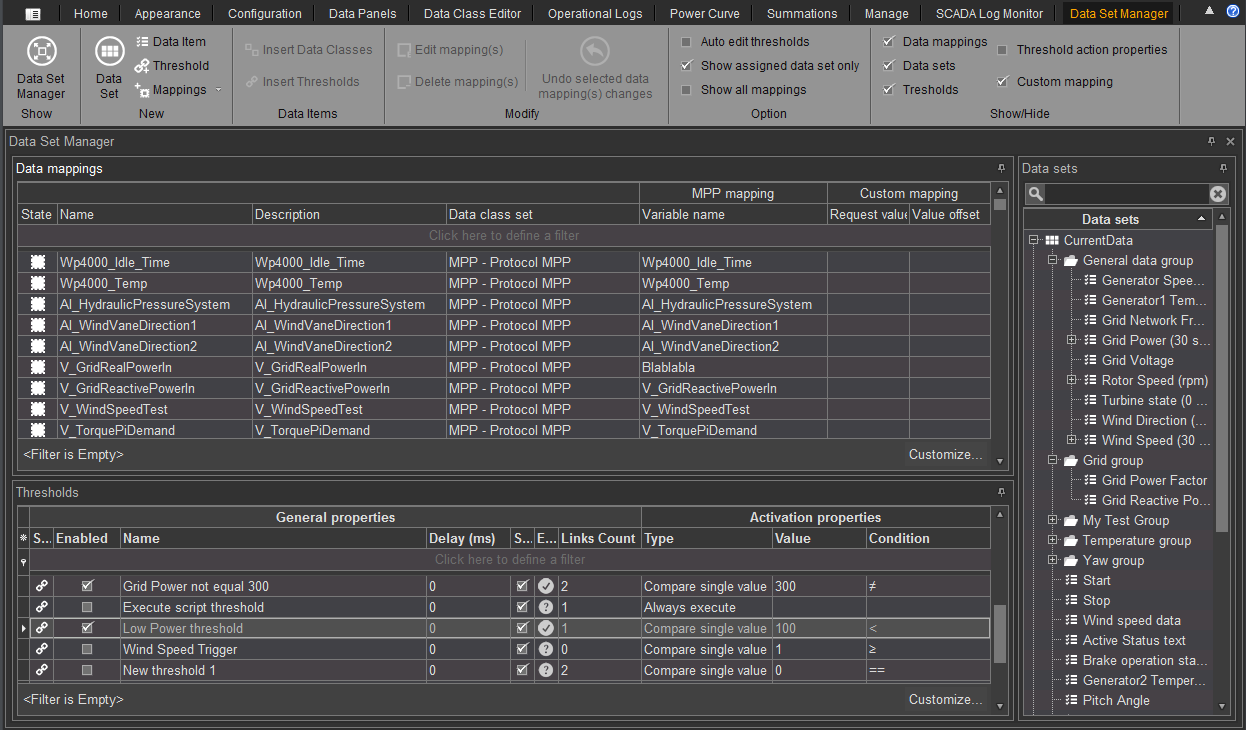
As soon as the required plug-in is loaded to Plugin Configuration, the Data Set Manager tab appears on the main application ribbon. Therefore, click Data Set Manager on the ribbon to open its toolbar.

As you can see, the Data Set Manager toolbar consists of the following sections:
Show section allows you to open the Data Set Manager window and view it within the main monitoring area.
New section provides a possibility of creating new items including data sets, data items, thresholds and mappings;
Data Items section contains Insert Data Classes and Insert Thresholds icons allowing users to quickly add data classes as well assign thresholds to the data items in the Data sets panel of the Data Set Manager main window:
- Insert Data Classes - This icon becomes enabled after selecting any of the data items listed in the Data sets panel. After pressing this icon a threshold currently selected in the Thresholds grid will be automatically assigned to the data item, which must also be currently selected in the Data Sets panel. This is vividly demonstrated in the Data set manager screen below.
- Insert Thresholds - Similarly to the Insert Data Classes icon, this button allows to quickly add data classes to the data set in the Data sets panel. After pressing this icon a data class currently selected in the Data classes grid will be automatically assigned to the data set, which must also be currently selected in the Data Sets panel.
Modify section contains a set of specific icons allowing to edit or delete selected mapping(s) as well as withdraw data mapping(s) changes;
Option section contains the following check-boxes:
- Auto edit thresholds - if selected, you'll be able to edit values in each column of the grid right after clicking it. Values in the selected column will be highlighted blue.
- Show assigned data set only - if selected, the Data sets panel displays only the data sets which are currently assigned to controllers configured in the Controller View;
- Show all mappings - if selected, all possible types of mappings are displayed in the Data classes grid in the middle of the main monitoring area including MPP mapping, MODBUS mapping, DAQ mapping, etc.;
Show/Hide section allows you to specify, whether the corresponding items will be shown/hidden by selecting/deselecting the corresponding check-boxes:
- Data mappings - On deselecting this check-box, the Data classes grid disappears from the Data Set Manager main window. To make this panel re-appear, you have to select the check-box.
- Data sets - On deselecting this check-box, the Data sets panel disappears from the Data Set Manager main window. To make this panel re-appear, you have to select the check-box.
- Thresholds - On deselecting this check-box, the Thresholds panel disappears from the Data Set Manager main window. To make this panel re-appear, you have to select the check-box.
- Threshold action properties - if selected, the Thresholds panel shows action properties for each of the available thresholds;
- Custom mapping - if selected, custom mapping is shown in the Data classes panel. Otherwise, it will disappear from the grid.
Data Set Manager consists of the Data mappings grid, the Thresholds grid and the Data sets panel.
Data mappings panel
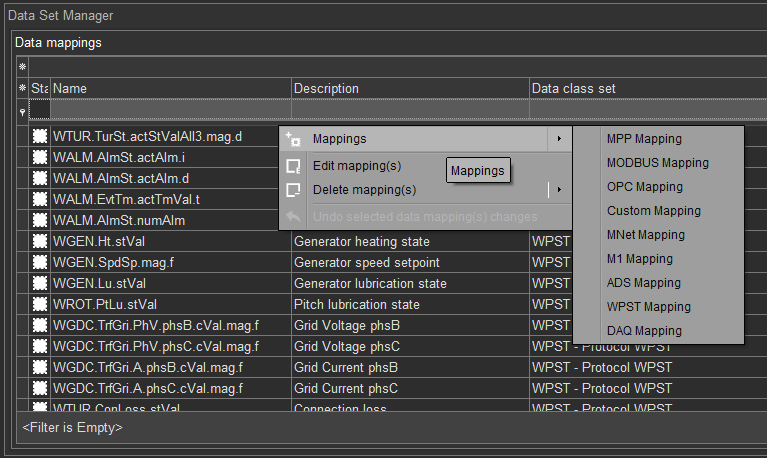
The Data mappings panel in the Data Set Manager is a table displaying all available data mappings. It also allows to create new data mappings, edit their properties as well as delete selected mappings.
Note. To be able to perform operations with mappings in the Data Set Manger, first make sure that the Data Class Editor(mtplDataClassEditor.bpl) plug-in is already available in the Plugin Configuration dialog. For more detail information, refer to Data Classes Setup.
To be bale to perform different operations with mappings, right-click within the Data classes panel to open the context-menu containing the following options:
- Mappings (MPP Mapping/Custom Mapping /MNet Mapping) - opens the Edit mapping(s) dialog allowing to create and configure a selected type of data mapping;
- Edit mapping(s) - opens the Edit mapping(s) dialog allowing to change settings of the currently selected data mapping;
- Delete (MPP Mapping/Custom Mapping/MNet Mapping) - allows to remove selected data mappings;
- Undo selected data mapping(s) changes - withdraws recent changes in data mappings.
For more detail information refer to Data Mappings tab described in the Data Classes Setup section of this manual.
Thresholds panel

The Thresholds panel in the Data Set Manager displays all available thresholds. It also allows to create new thresholds, edit their properties as well as delete selected thresholds.
To be bale to perform different operations with thresholds, right-click within the Thresholds panel to open the context-menu containing the following options:
- Threshold - opens the Edit threshold dialog allowing to create and configure a threshold;
- Edit threshold - opens the Edit threshold dialog allowing to change settings of the currently selected threshold;
- Delete threshold - allows to remove a currently selected threshold;
- Undo - cancels recent threshold changes.
For more detail information, refer to the section Configuring Thresholds in this manual.
Data sets panel
Data sets panel displays all available data sets, which you can easily recognize by the corresponding icon next to the data set name:  . To extend a certain data set, click the
  icon next to the required data set.
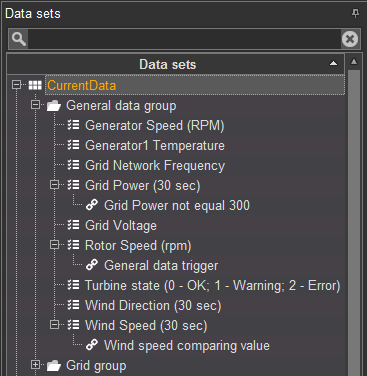
On revealing the data set, you can see all data items assigned to it. Besides, the data items are displayed in groups, configured by a user. If a threshold has been assigned to the data item, it will also appear in the Data sets panel.
The whole functionality of the Data sets panel is very user-friendly, as it allows adding data items to groups and data sets using drag-and-drop. Therefore, users are allowed to move data items backwards and forwards within the Data set panel, thus assigning the items to new groups and data sets. Besides, when dealing with a big amount of data items, you can easily find the required item using a field next to the  icon
icon
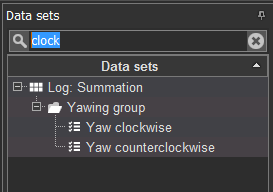
Therefore, to find a corresponding icon specify the criteria for filtering: e.g. "clock". As a result, the Data Sets panel will display only data items having "clock" as a part of their names. As you can see in the screen above, filtered data items are displayed with corresponding groups and data sets they relate to.
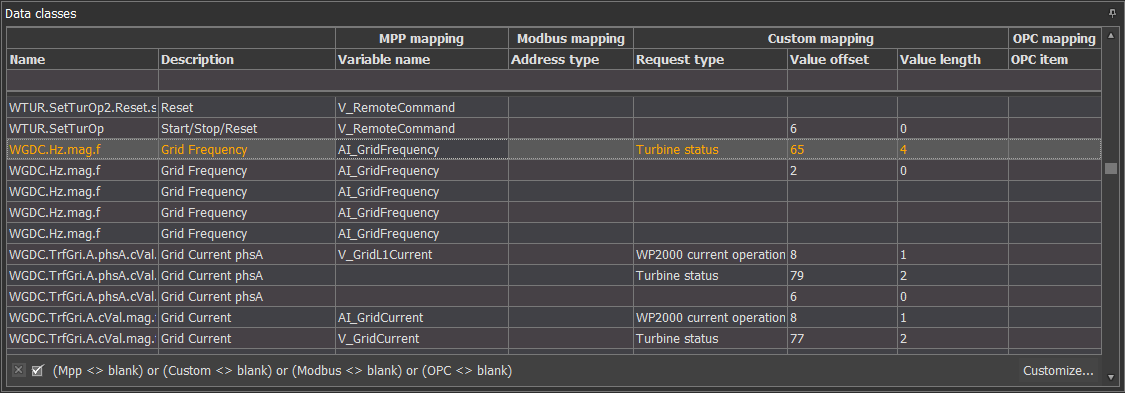
Selecting the required data set in the Data Sets panel to the right displays data classes associated with it in the Data classes grid. Selecting a certain item displays a data class together with its mapping in the Data classes grid.
MiCMS default data set
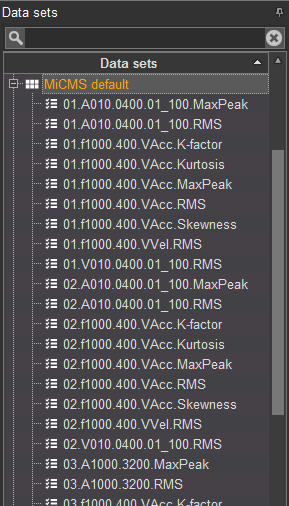
In contrast to user configured data sets, MiCMS default data set is the default one, meaning that it is automatically created by the system when installing MiScout SCADA. As you can see on the below screen, the default data set contains a list of pre-defined CMS data items. Further on, these data items will serve as channels for providing controller online data in Vibration Monitor, for example.
Configuring a data set
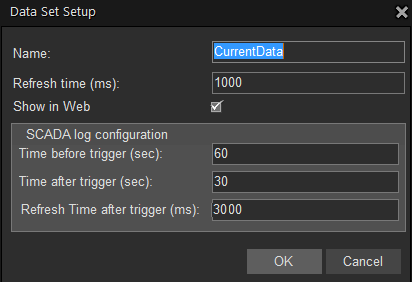
Each selected data set can be edited by clicking the  Edit Data Set icon or by using a double click over its name in the Data Sets panel. As a result, the Data set setup window reveals, allowing you to adjust the following parameters:
- Name - enter any readable name for a data set, which will appear in the Data sets panel;
- Refresh time (ms) - allows setting the required refresh time. MiScout requests all items from a data set not faster than the refresh time set in milliseconds, unless some other value hasn't been overwritten in the Data Item;
- SCADA log configuration: allows to configure the data set parameters for the SCADA log;
- Average period (min) - set the average period in minutes, which will be used for the Average log. 10 minutes is set as a default value.
- Time before trigger (sec) - when Trigger Log is generated, this value defines the time frame for which data are included before the trigger time.
- Time after trigger (sec) - when Trigger Log is generated, this value defines the time frame for which data are included after the trigger time (i.e. after the trigger is fired).
- Refresh Time after trigger (ms) - allows setting a desirable refresh time interval in milliseconds, at which MiScout will be requesting data after the trigger time. If this property isn't set, data will be requested at an interval set in the Refresh time (ms) property field.
Configuring a data item
Each selected data item can be edited with the help of the  Edit Data Item icon or by using a double click over its name in the Data Sets panel or in the Data classes grid. As a result, the Edit data item window reveals within the main monitoring area.
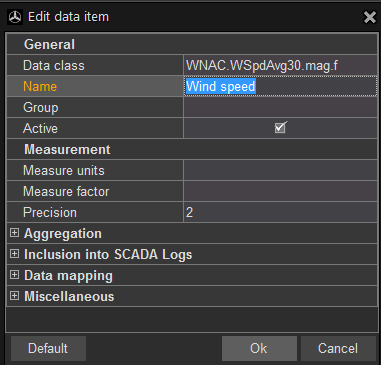
On clicking the  plus icon next to Aggregation, Data mapping etc. property fields you will be able to view all the data item properties on the main screen.
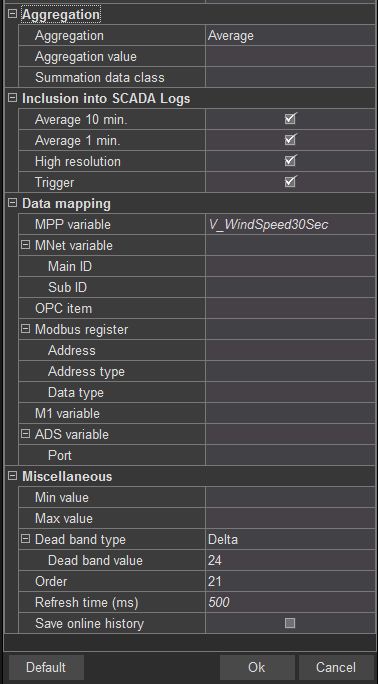
In the revealed Edit data item dialog, a user can configure the following data item properties:
General :
- Data class - click within this property field and select a data class related to the configured data item;
- Name - enter any readable name for a data item, which will appear on the MiScout GUI;
- Group - Click this property field and select a corresponding group from the revealed drop-down list. As a result, the data item will belong to the specified group and will be displayed under it in the Data sets panel. As soon as this configured data item is selected for generating the log, it will appear on the screen under the appropriate group name in the Channels section of the log chart. The Group property also allows creating a new group by enter a desirable group name. Right after its creation, a new group will appear in the Data sets panel displaying the corresponding data item underneath.
- Active - to activate the data item, select the Active check-box. If the Active check-box is not selected, no data will be received by this data item;
Measurement
- Measure units - set the corresponding measure units;
- Measure factor - set the measuring coefficient for converting the online data retrieved from the controller;
- Precision - a number of digits after the decimal point;
Aggregation
- Aggregation - the way the received data will be aggregated. Possible options are: None, Sum, Average, Min, Max, Standard deviation count and Last valid value. Aggregation is used to collect Data items in Average Log as well as aggregate data on higher level of hierarchy, e.g. park level.
- Aggregation value - could be used in combination with Aggregation type Count, if, for example, you'd like to show the number of times a variable received a certain value - therefore, enter this value in the field.
- Summation data class - is used for data items configured for SCADA summations calculation. Defines the summation data class used for calculating the summations.
Inclusion into SCADA Logs:
- Average 10 min. - if selected, this data item will be involved in generation of the Standard SCADA Average log. Otherwise, a user won't find any information on this data item in the log.
- Average 1 min. - if selected, this data item will be involved in generation of the Detail SCADA Average log. Otherwise, a user won't find any information on this data item in the log.
- High resolution - if selected, this data item will be involved in generation of this type of SCADA log. Otherwise, a user won't find any information on this data item in the log.
- Trigger - if selected, this data item will be involved in generation of this type of SCADA log. Otherwise, a user won't find any information on this data item in the log.
Data mapping
- MPP variable - shows the name of the variable related to the selected sata item for the MPP protocol;
- MNet variable - this property field allows a user to configure a data source allowing direct receiving of data via MNet protocol;
- Main Id - enter a corresponding value denoting an address of the group of variables on the controller;
- Sub Id - - enter a proper value denoting a variable address in the corresponding group of variables.
- OPC item - set an OPC item related to the selected data item for the OPC protocol;
- Modbus register - allows setting parameters for MODBUS mapping including;
- Address - the place in the register;
- Address type - the following types are available for this property field: Input register, Discrete Input, Holding Register (Register), Discrete Output (Coil);
- Data type - the type of data according to IEEC;
- M1 variable - specify a variable to access it in the M1 controller;
- ADS variable - this property field allows a user to configure a data source allowing direct receiving of data via ADS protocol type;
- Port - specify the port number, which will be used for distinguishing the sub-elements in the connected ADS controller;
Miscellaneous
- Min value - set a minimum value to define a range of possible values;
- Max value - set a maximum value to define a range of possible values;
- Dead band type - select the required dead band type (Delta, Percent);
- Dead band value - specify the dead band value;
- Order - setting a value allows to increase/decrease the priority; by default, "0" value is set automatically;
- Refresh time (ms) - set the required refresh time for the configured data item;
- Save online history - if selected, the history of the online data will be saved. This means, that on launching SCADA Log Monitor values for the last 10 minutes' period will be shown for the corresponding data items.
Note. Fill in these fields, if communication with the controller supports “subscription” (usually supported by some OPC servers). If values are filled in, then data source sends the data when value change exceeds the set dead band. Dead band type defines, whether the value is set in percentage or in absolute units.
If required, the properties of the configured data item can be set back to the default ones by clicking the  icon in the Edit data item dialog.
Using right-click context menu for configuring data sets and data items
Using the right mouse click over a data set or a data item within the Data sets panel area reveals a context menu.
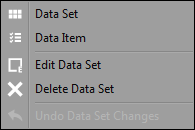
On right-clicking a data set, a context-menu looks as follows:

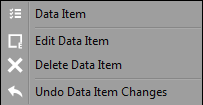
Whereas, on right-clicking a data item, a revealed context-menu contains a little bit different set of available options:

Using the menu options (see the screens above), you can perform the following actions:
- creating new data sets or data items by selecting Data Set or Data Item options in the menu;
- changing data set or data item properties by clicking Edit Data Set and Delete Data Set options in the menu;
- withdrawing recent changes by clicking Undo Data Set Changes or Undo Data Item Changes.
Another possibility to create new data items, data sets, thresholds and mappings is by using the corresponding icons in the New section of the Data Set Manager toolbar (see the screen found in the Data Set Manager interface described at the beginning of this section).


 . To extend a certain data set, click the
  icon next to the required data set.
 icon
icon 


![]() Edit Data Set icon or by using a double click over its name in the Data Sets panel. As a result, the Data set setup window reveals, allowing you to adjust the following parameters:
Edit Data Set icon or by using a double click over its name in the Data Sets panel. As a result, the Data set setup window reveals, allowing you to adjust the following parameters:
![]() Edit Data Item icon or by using a double click over its name in the Data Sets panel or in the Data classes grid. As a result, the Edit data item window reveals within the main monitoring area.
Edit Data Item icon or by using a double click over its name in the Data Sets panel or in the Data classes grid. As a result, the Edit data item window reveals within the main monitoring area.
 plus icon next to Aggregation, Data mapping etc. property fields you will be able to view all the data item properties on the main screen.
 icon in the Edit data item dialog.