

|
Data Class Editor allows users to create, modify, delete data classes and map them to different mapping entities. In this way, Data Class Editor makes it possible to neatly organize monitoring of almost all live data supported by the controller firmware.
Generally speaking, a data class is a simple data item with several attributes such as name, description, type, unit, min and max values used for determining a simple physical quality, which can be, for example - wind speed, active power, pitch angle, etc.
Data class names are standardized by the IEC standard 61400-25 series, enabling uniform data presentation regardless of the vendor. Once created, a single data class can be easily re-used for various units, and different mapping can be applied depending on the variables used in the application running on the controller. Thus, MiScout SCADA Desk allows a user to create different types of mapping, including MODBUS mapping, OPC mapping, VMP mapping,, ADS Mapping, etc. Each type of mapping is described in more detail further in this section.
To be able to use Data Class Editor, the Data Class Editor(mtplDataClassEditor.bpl) plug-in is required. Therefore, first of all, make sure that it is already listed in the Plugin Configuration dialog. For more detail information, refer to Configuring Plug-ins.
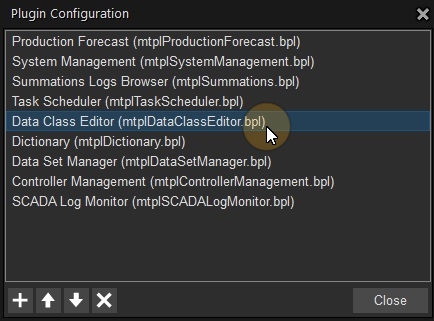
As soon as the required plug-in is loaded to Plugin Configuration, the Data Class Editor tab appears on the main application ribbon. Therefore, click Data Class Editor on the ribbon to open its toolbar.

The Data Class Editor tab contains the following sections:
Import/Export section allows exporting data of the selected mapping sets into the.csv file format. And vice versa, using the Import icon it is possible to import data from the .csv file to the required mapping set.
Import - writes data from the .csv file to the prior selected mapping set;
Export - writes data from the mapping set into the .csv file format.
The Data classes window allows a user to perform the following actions:
Further in this section you will find more detail instructions on how to perform each of the above mentioned actions.
According to the IEC 61400-25 standard, all data classes are grouped into the following logical nodes:
The attributes below could also be used in data classes manes according to the IEC-61400 format:
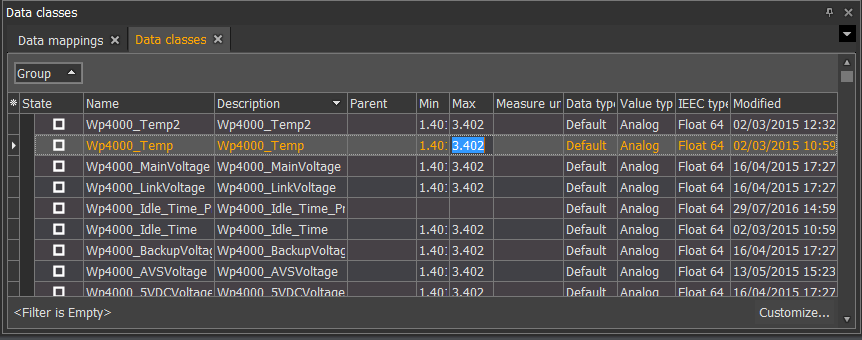
Data classes are grouped and displayed in the grid containing the following columns: Name, Description, Parent, Measure unit, Data type, Value type, IEC type and Modified.
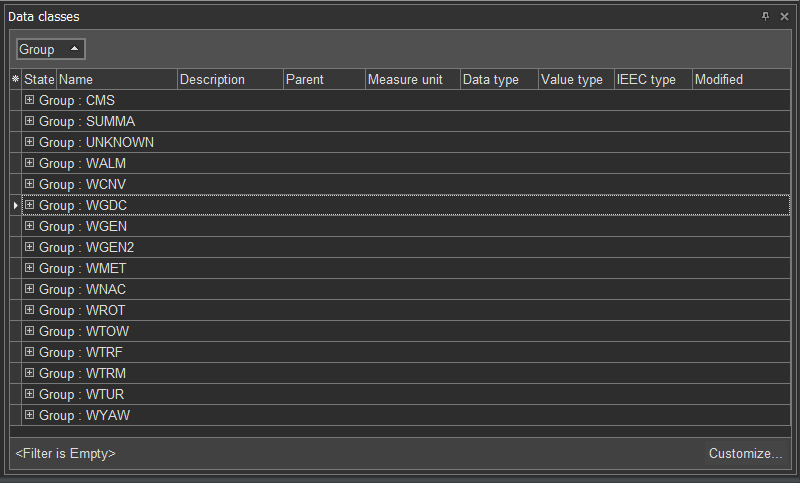
Data classes filter
As already mentioned earlier in this section, all available data classes are gathered in separate groups, which can be expanded by clicking the  plus icon.
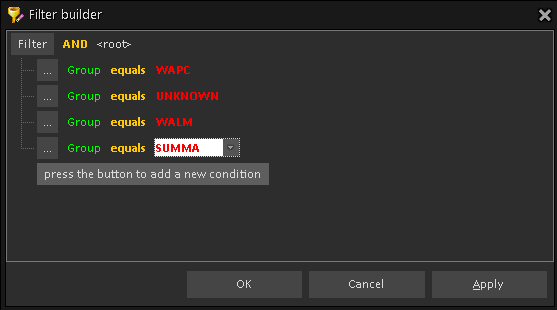
All these data classes can be easily filtered by clicking the Group  icon and by selecting the required data class(es) in the drop-down menu. MiScout Desk allows to filter data classes in each column of the grid using the
  filter icon next to the column name. So, all a user needs, is to set the required options in the Custom Filter dialog.
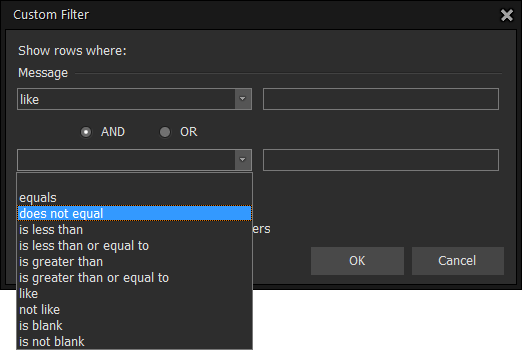
Click the Customize...  icon at the bottom of the Data classes window to customize your filter by setting proper parameters and conditions.
Creating and configuring data classes
User can edit the value of each column or edit the whole data class by clicking the
 black square icon. Alternatively, you can double-click any of the data classes displayed in the Data classes window to activate the Edit data class(es) dialog. Right after the Edit data class(es) dialog appears, you can start configuring values in the property fields.
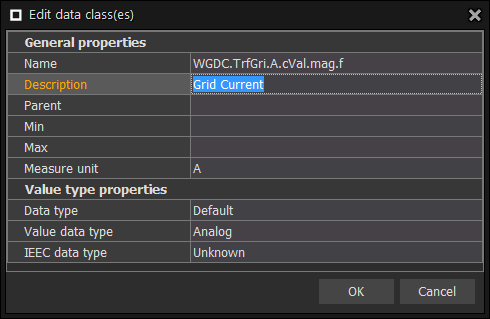
The same Edit data class(es) dialog will appear on clicking the  Data Class icon, when adding a new data class. After right-clicking the selected data class, a menu opens allowing a user to create data class(es) as well as edit and delete the existing ones.
Also, a user can easily withdraw recent changes by clicking the Undo data class(es) changes option at the very bottom of the context-menu.
In the New section of the Data Class Editor toolbar resides the Summation icon allowing you to create different types of summation data classes. Below you will find a step by step description on how to create and configure Energy Summation.
1. On clicking the Summation icon, select the Energy Summation option in the revealed menu. This menu lists all types of summation available in
![]()
As a result, the Edit Summation Data Classes dialog appears allowing a user to configure properties for a new data class.
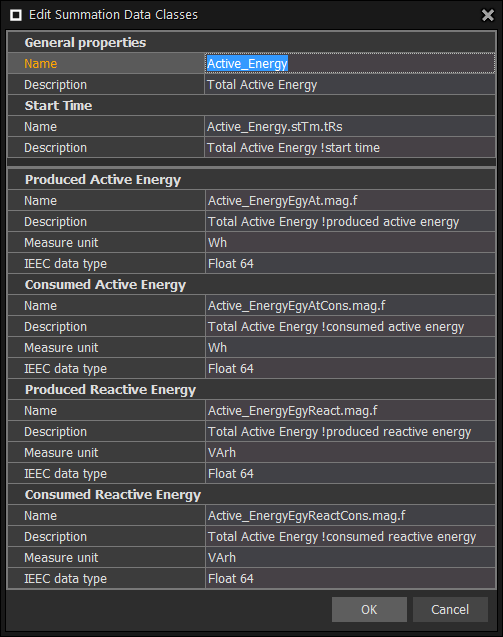
2. Make proper settings in the Edit Summation Data Classes dialog.
General properties - Property fields residing in this section specify a parent data class for the selected summation.
Note. Fields found in the General properties section of the Edit Summation Data Classes dialog are common for all summation types and refer to only the parent data class. Name and Description are obligatory fields, which a user must necessarily configure, as rest dialog properties are assigned default settings based on configurations made in General properties. Rest dialog sections (i.e. Produced/Consumed Active Energy, etc.) contain property fields allowing to configure child data classes.
Start Time - Property fields of this section specify a child data class allowing time calculation.
Note. Default child data class name consists of the name of the corresponding parent data class and the specific attribute standardized according to IEC 61400-25. In our case with Energy Summation, full default name for the child data class is "Active_EnergyTotEgyAt.mag.f", which consists of the parent data class name "Active_Energy" and the specific attribute "TotEgyAt.mag.f"S.
Produced Active Energy - Property fields of this section specify a child data class allowing calculation of produced active energy.
Other dialog sections describing rest child data classes are listed below, each containing the same set of properties as Produced Active Energy.
Consumed Active Energy - Property fields of this section specify a child data class allowing to calculate the amount of consumed active energy.
Produced Reactive Energy - Property fields of this section specify a child data class allowing calculation of produced reactive energy.
Consumed Active Energy - Property fields of this section specify a child data class allowing to calculate the amount of consumed active energy.
Consumed Reactive Energy - Property fields of this section specify a child data class allowing calculation of consumed reactive energy.
3. On configuring all the dialog sections, press OK.
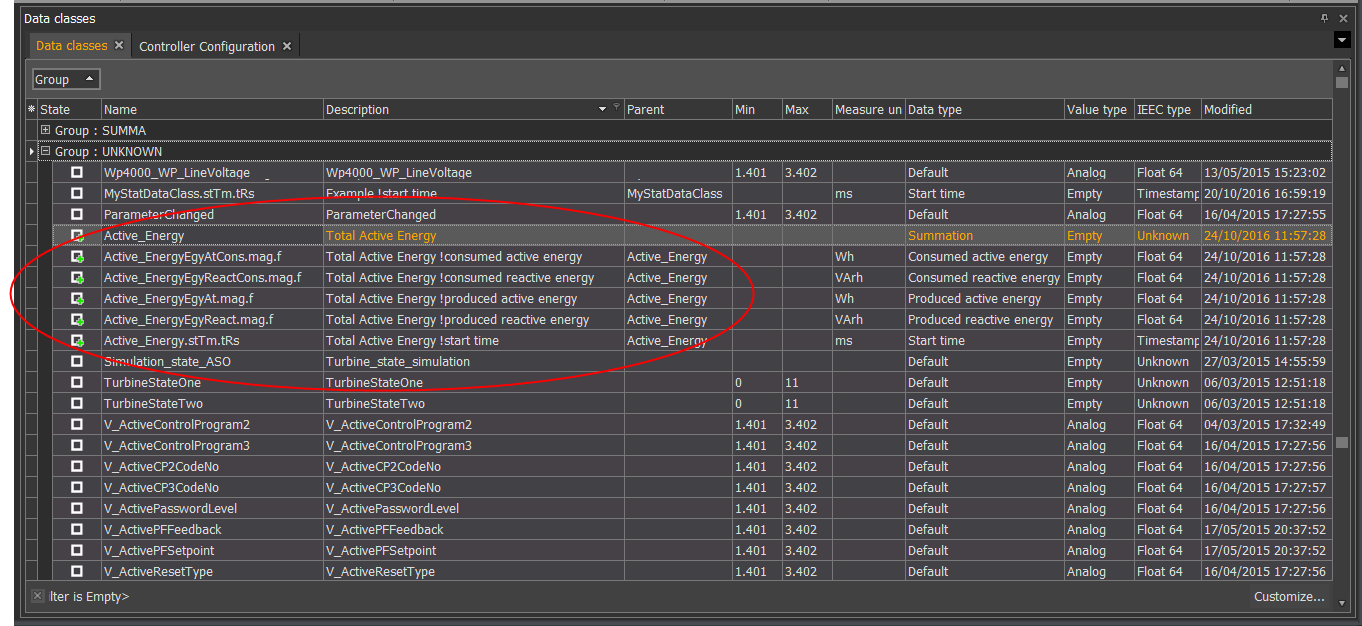
If done successfully, the following parent and child data classes will be created, which you'll be able to view in the Data classes window:
- One new parent data class will be added to the list named as
- Active_Energy
- Also, five new child data classes will be created.
- Active_EnergyEgyAtCons.mag.f
- Active_EnergyEgyReactCons.mag.f
- Active_EnergyEgyAt.mag.f
- Active_EnergyEgyReact.mag.f
- Active_Energy.stTm.tRs
4. Click the  Commit Changes icon in the upper left corner, so that all configuration changes are successfully saved on the server.
The process of creating and configuring Service and Statistic Summations is similar to the one described for Energy Summation. For more detail instructions, see Configuring Summations described earlier in this section. However, the number of created child data classes differs for each summation type:
for Service Summation one parent and three child data classes will be created, while
for Statistic Summation one parent and four child data classes will be added.
You remember, of course, that for Energy Summation one parent and five child data classes are added. Further in this section, you will find screens showing possible configuration settings for Service and Statistic Summations.
Service summation
In the screen below possible configuration of Service Summation is provided.
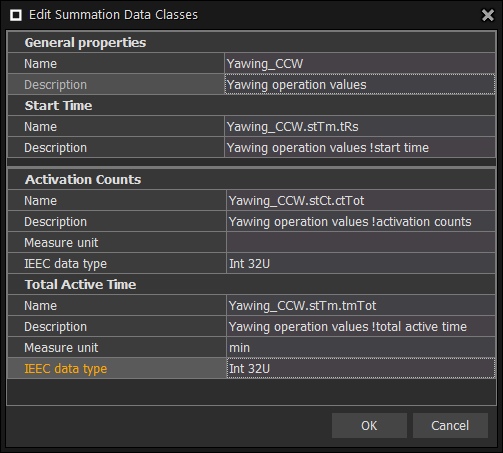
As you can see, the Edit Summation Data Classes dialog presents a list of properties, which a user has to configure for the selected summation type. See also the Note above.
General properties - Property fields residing in this section specify a parent data class for the selected summation.
Start Time - Property fields of this section specify a child data class allowing time calculation.
Activation Counts - Property fields of this section specify a child data class allowing calculation of yawing movements.
Total Active Time - Property fields of this section specify a child data class allowing time calculation. This section contains the same property fields as presented in the Activation Counts section above. But we would like to draw your attention to min, a default setting in the Measure unit property. You can change this default value to s. As a result, the calculated yawing time will be shown in seconds instead of minutes.
Statistic summation
In the screen below possible configuration of Statistic Summation is provided.
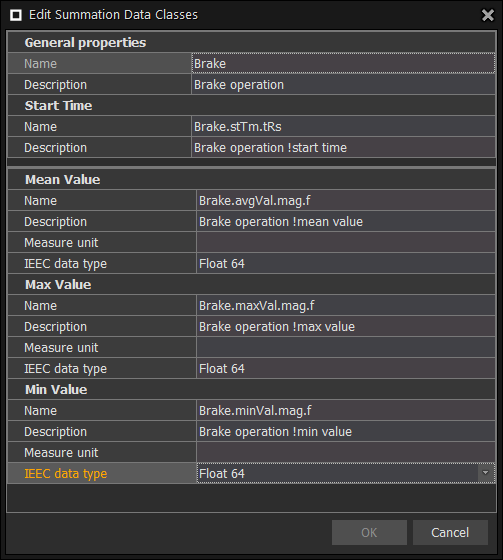
As you can see, the Edit Summation Data Classes dialog presents a list of properties, which a user has to configure for the selected summation type. See also the Note above.
General properties - Property fields residing in this section specify a parent data class for the selected summation.
Start Time - Property fields of this section specify a child data class allowing time calculation.
Mean Value - Property fields of this section specify a child data class allowing calculation of yawing movements.
Other dialog sections describing rest child data classes are listed below, each containing the same set of properties as Mean Value.
Max Value - Property fields of this section specify a child data class allowing calculation of maximum value.
Min Value - Property fields of this section specify a child data class allowing calculation of minimum value.
In case of successful configuration of summations, the following parent and child data classes will be created, which you'll be able to view in the Data classes window:
.png)
As seen on the screen above, all user configured summation data classes are found under the UNKNOWN node in the Data classes window. The thing is, that recently added data classes bear random names (i.e. any names desired by a user), not complying with the data class names standardized in the IEEC 61400-25 standard. The key advantage of this approach is to make the overall process of creating data classes easier and more user-friendly. For more information, see the IEC 61400-25 standard mentioned at the beginning of this section.
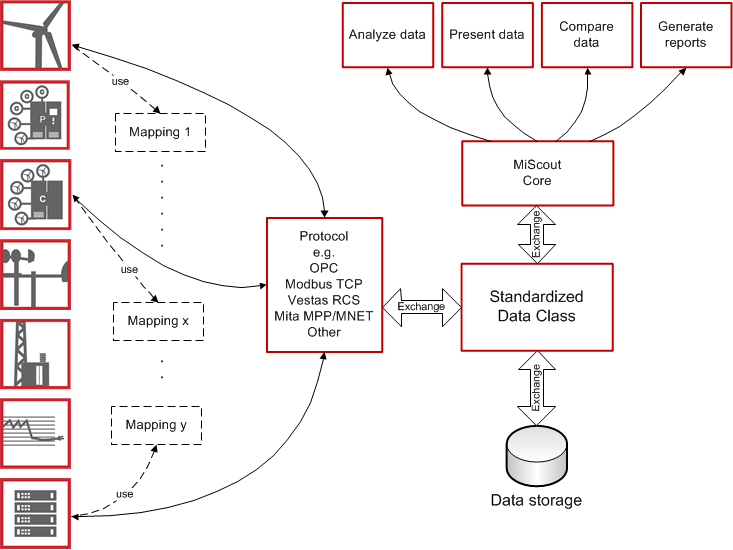
Data Mappings allows a user to create new data mappings as well as edit the existing mappings. You can easily reach the Data Mappings icon, which resides in the Show section on the toolbar.

To edit the existing data mapping, a user has to select the required mapping set in the Mapping sets panel found to the right of the main monitoring area. All listed mapping sets are grouped according to different protocol types (e.g. DCE3, MODBUS, MPP, etc.). Depending on the selected protocol type, the grid contains specific columns, which are available for editing. Columns Name and Description are common for all protocol types.
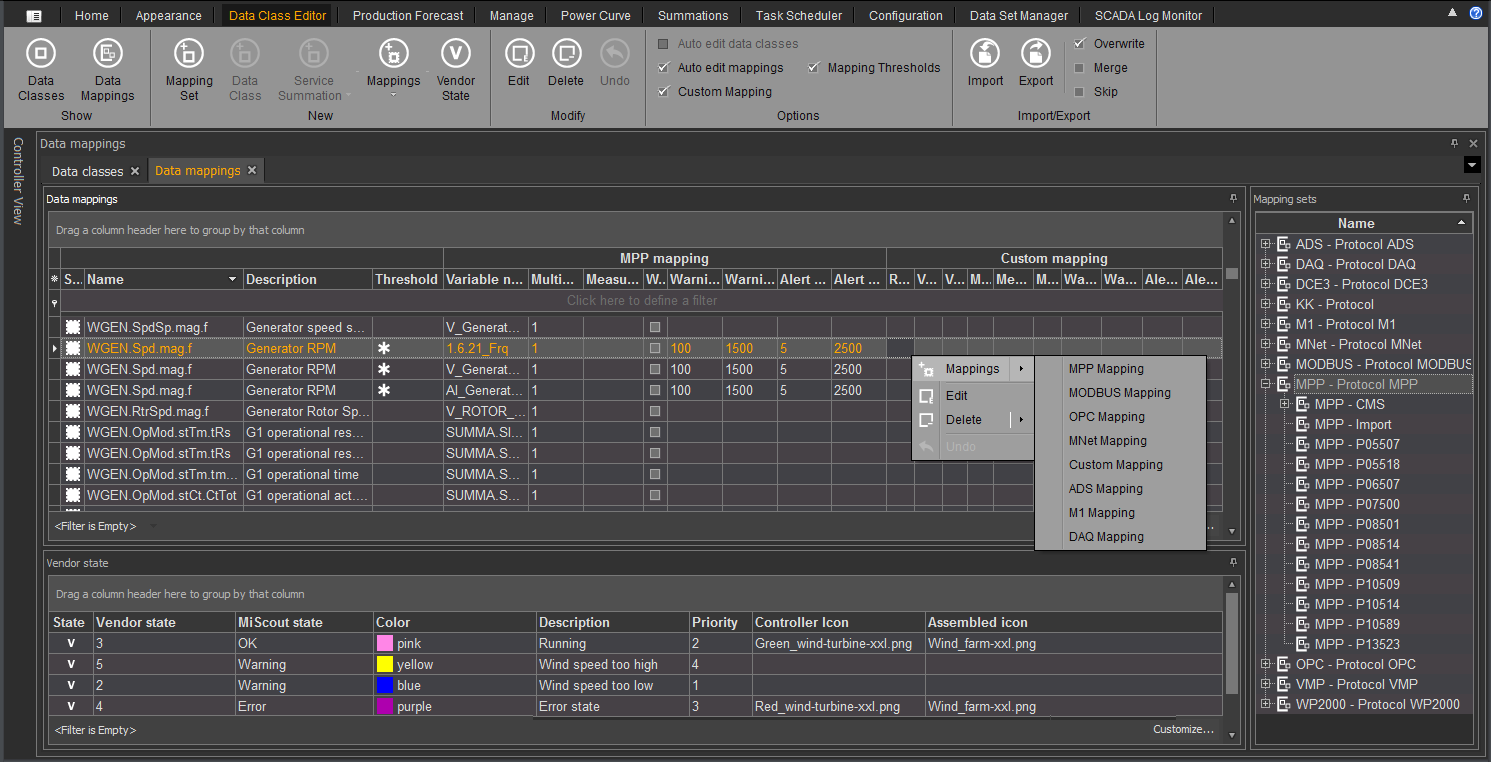
As shown on the above screen, with the help of a mouse right-click on the selected data mapping, a menu will open allowing you to edit or delete available data mapping(s).
A new mapping can be created by clicking the  Mappings icon in the New section on the main toolbar. Clicking the downward-arrow icon of the
  Mappings icon reveals the following types of mapping:
![]()
Upon selecting one of the available mappings, the Edit mapping(s) dialog appears onscreen allowing a user to create a new data mapping. For more detail information, see Editing Data Mapping described further in this section.
User can edit the value of each column or edit the whole data set by clicking the  icon, which will reveal the Edit mapping(s) dialog on the main screen. This dialog allows a user to edit the following properties:
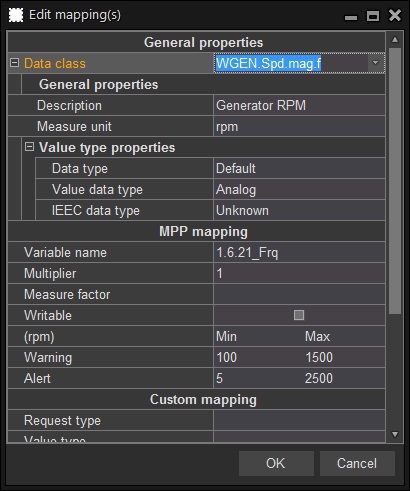
General properties are common for all protocol types.
Value type properties are inherited from the selected data class:
Custom mapping is common for all protocol types.
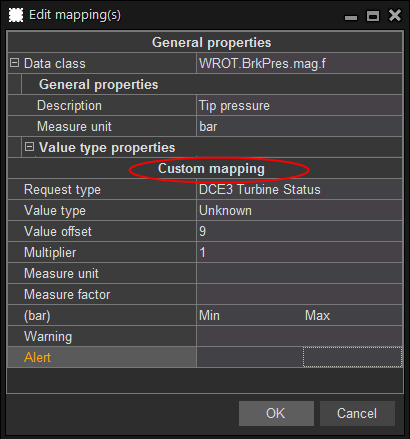
If a user sets Min/Max values in the Warning and Alert property fields, this mapping will be marked by an  Asterisk icon under the Threshold column of the Data mappings window. Also, to view Min/Max values pre-configured in the Warning/Alert fields in the Data mappings window, make sure that the Mapping Thresholds check-box is enabled in the Options section of the toolbar.
Note.Yellow and red horizontal lines representing the upper/lower levels to define warning and alert ranges can be viewed in SCADA Log Monitor, SCADA Average Logs (Detail and Standard), SCADA High Resolution Log, SCADA Trigger Log.
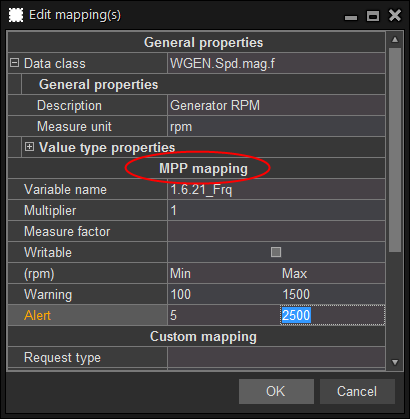
For MPP Protocol you can edit MPP mapping values including Variable Name, Measure Factor and Writable property fields:
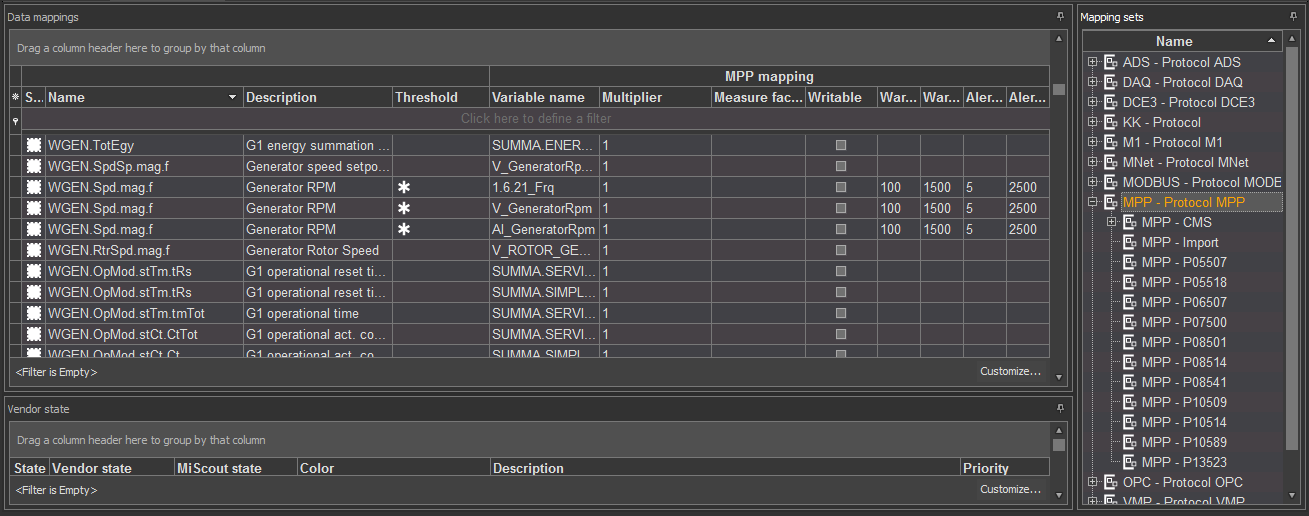
MPP mapping configuration
If a user sets Min/Max values in the Warning and Alert property fields, this mapping will be marked by an  Asterisk icon under the Threshold column of the Data mappings window. Also, to view Min/Max values pre-configured in the Warning/Alert fields in the Data mappings window, make sure that the Mapping Thresholds check-box is enabled in the Options section of the toolbar.
Note.Yellow and red horizontal lines representing the upper/lower levels to define warning and alert ranges in MiScout Desk can be viewed in SCADA Log Monitor, SCADA Average Logs (Detail and Standard), SCADA High Resolution Log, SCADA Trigger Log. In MiScout Web yellow and red horizontal lines representing thresholds appear in the Average Log tab.
Important Note. User can set Min and Max values for Warning and Alert property fields in the Edit mapping(s) dialog window in all types of mappings described further in the Data Mappings Tab section including ADS mapping, M1 mapping, etc.
For OPC Protocol you can edit OPC mapping which includes filling in the following fields: OPC Item, Multiplier, Measure Factor, Value offset and Measure unit.
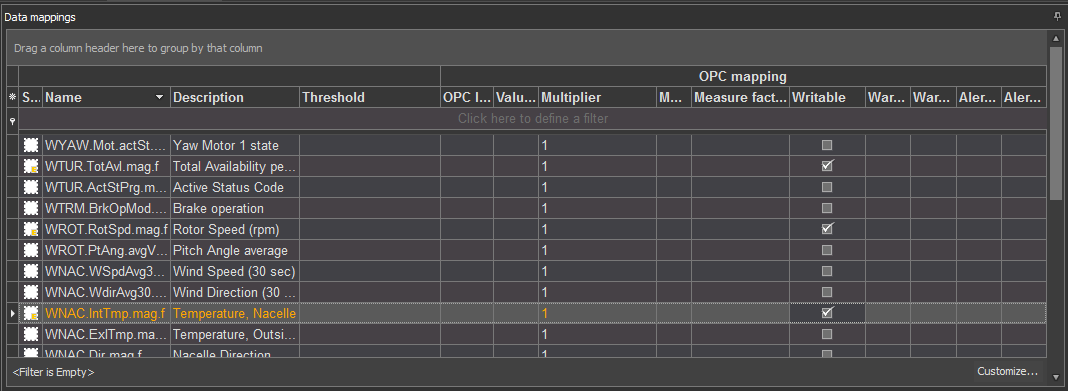
OPC mapping configuration
Set the following values for the OPC Protocol type:

User can edit MODBUS mapping for a MODBUS protocol type filling in the property fields shown in the screen below:
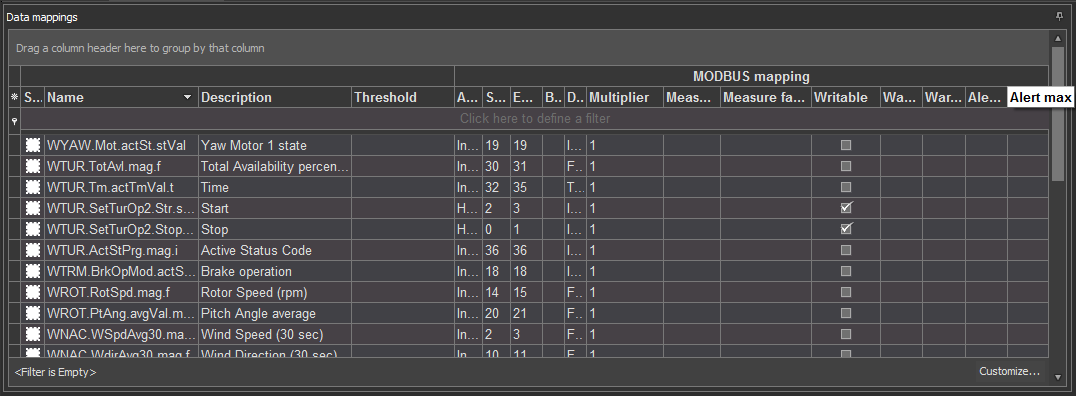
MODBUS mapping configuration
For the MODBUS Protocol type, set values for the following property fields:
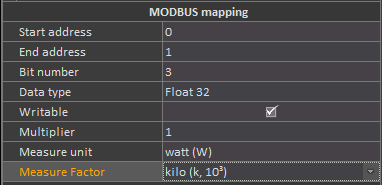
In the Address types property field a user is free to assign the following address types to data classes:
Writable - If the check-box is selected for the Input Register address type, it automatically switches to => Holding Register and vice versa. Similarly, selecting this check-box for Discrete Input results in changing the address type to =>Discrete Output.
MODBUS mapping specific properties
Based on the address type, user can select the following options provided in Data type.
For Input Registeror Holding Register address type:
For Discrete Input or Discrete Output address type:
Other Data type options are as follows:
Other properties specific to MODBUS mapping:
User can edit ADS mapping for the ADS protocol type filling in the property fields shown in the screen below.

For the ADS protocol type, set values for the following property fields:
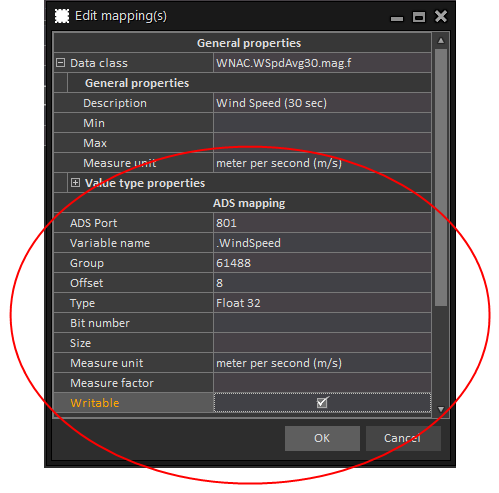
ADS mapping specific properties
The port number distinguishes sub-elements in the connected device. The list bellow displays the following ADS port numbers being already assigned:
| ADS Port Number | ADS device description |
|---|---|
| 100 |
Logger (only NT-Log) |
| 110 | Eventlogger |
| 300 | IO |
| 301 | additional Task 1 |
| 302 | additional Task 2 |
| ... | |
| 500 | NC |
| 801 | PLC RuntimeSystem 1 |
| 811 | PLC RuntimeSystem 2 |
| 821 | PLC RuntimeSystem 3 |
| 831 | PLC RuntimeSystem 4 |
| 900 | Camshaft controller |
| 10000 | System Service |
| 14000 | Scope |
It should be pointed out, that while configuring ADS mapping there are two ways for identifying (i.e. reading) a variable in MiScout SCADA:
Condition A- This way of reading a variable will be implemented only on condition, that the ReadVariableInfo property field is set to True (see ReadVariableInfo in the Creating an ADS controller section).
Condition B- This way of reading variables will be enabled, if the ReadVariableInfo property field is set to False (see ReadVariableInfo in the Creating an ADS controller section).
Note. If the type of the configured variable is STRING, a user must necessarily configure the Size property field.
M1 mapping
User can edit M1 mapping for the M1 protocol type by filling in the property fields shown in the screen below:

For the M1 protocol type, set values for the following property fields:
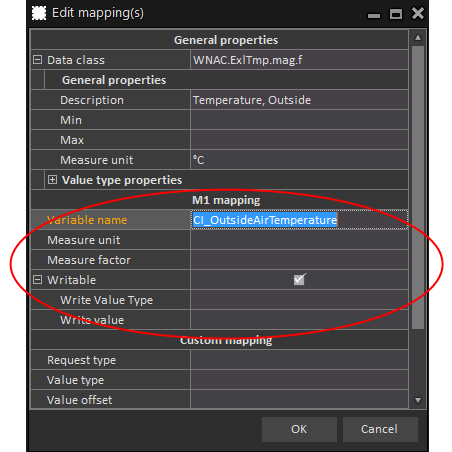
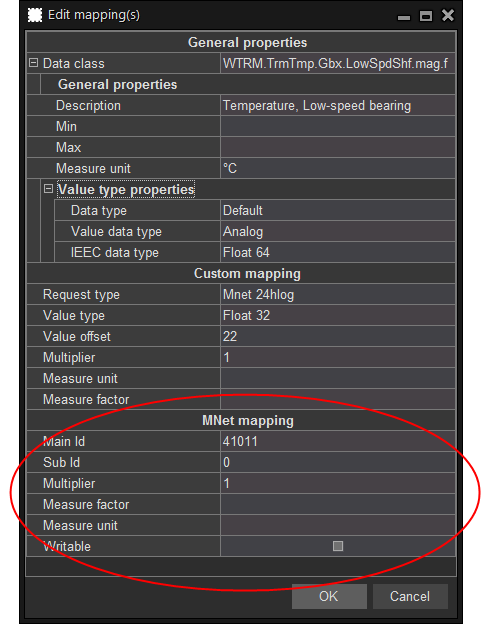
The screen below shows MNet mapping for the MNet type of controllers:

MNet mapping configuration:
For the MNet protocol type, set values for the following property fields:
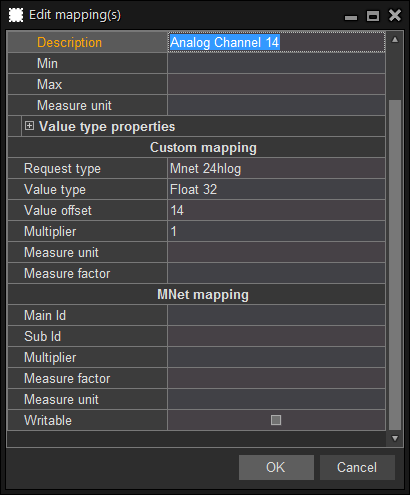
Custom mapping
Custom mapping for MNet controllers serves for defining the relation between the channel and the assigned data class. It is mainly used for the Average Log type. Thus, if required user is free to set properties for the custom mapping as shown in the screen below:
User can edit Custom mapping for VMP Protocol including the following property fields: Request type, Raw data type, Value Offset, Value length, Multiplier and Measure Factor. More detail information you can find in Editing Data Mapping described earlier in this section.

The following mapping can be used for the VMP Protocol type:
Y Overview Current request type:
Each of the listed numbers defines a value offset in the specific request type:
Y Overview Wind request type:
Y Production request type:
Y Temperatures actual request type:
VMP3500 controller type
VMP5000.01/02 controller type:
Y Electrical current request type:
Y Hour counters request type:
B General Status request type:
Data Mappings for WP2000 Protocol.
Below you will find description of the default WP2000 mapping in MiScout Desk.
Standard data - a package supported by all types of wind turbines, containing key operational data, including the following:
Operation Data - a package supported by all types of wind turbines, containing the following summations data:
Temperature Data - a package, which is supported by the Nordex wind turbines.
Weather data - a package supported by weather stations only.
Data mappings for DCE3 protocol
For DCE3 Protocol user can edit Custom mapping including Request type, Value type, Value Offset, Value length, Multiplier and Measure factor properties. More detail information on this topic can be found in Editing Data Mapping described earlier in this section.
The following mapping can be used for the DCE3 protocol type:

Each of the listed numbers defines a value offset in the specific request type
DCE3 Turbine Status request type:
Grid data request type:
Temperatures request type:
Production data request type:
Operation Duration counters request type:
Operation counters request type:
For KK Protocol a user can edit Custom mapping including Request type, Value type, Value Offset, Multiplier, Measure unit and Measure factor properties. More detail information on this topic can be found in Editing Data Mapping described earlier in this section.
The following mapping can be used for the KK protocol type:

Each of the listed numbers defines a value offset in the specific request type
KK Data request type:
Data mappings for WPST Protocol
For WPST -Protocol a user can edit Custom mapping including Request type, Value type, Value Offset, Multiplier, Measure unit and Measure factor properties. More detail information on this topic can be found in Editing Data Mapping described earlier in this section.
The following mapping can be used for the WPST Protocol type:

Each of the listed numbers defines a value offset in the specific request type
Yaw Status request type:
Brake Status request type:
Energy request type:
Data mappings for WW-QCP-Protocol
For WW-QCP-Protocol a user can edit Custom mapping including Request type, Value type, Value Offset, Multiplier, Measure unit and Measure factor properties. More detail information on this topic can be found in Editing Data Mapping described earlier in this section.
The following mapping can be used for the WW-QCP-Protocol type:
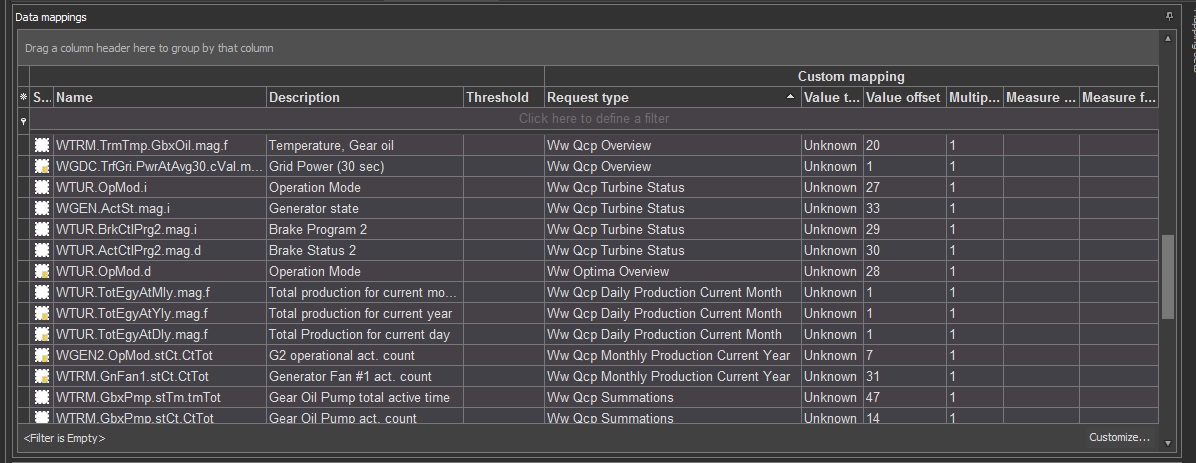
Each of the listed numbers defines a value offset in the specific request type
Ww Qcp Overview request type:
Turbine Status QCP request type:
Ww Qcp Summations request type:
Ww Qcp Production request types:
1 - Ww Qcp Hourly Production Current Day
1 - Ww Qcp Daily Production Current Month
1 - Monthly Production Current Year
Data mappings for WW-Optima-Protocol
For WW-Optima-Protocol a user can edit Custom mapping including Request type, Value type, Value Offset, Multiplier, Measure unit and Measure factor properties. More detail information on this topic can be found in Editing Data Mapping described earlier in this section.
The following mapping can be used for the WW-Optima-Protocol type:
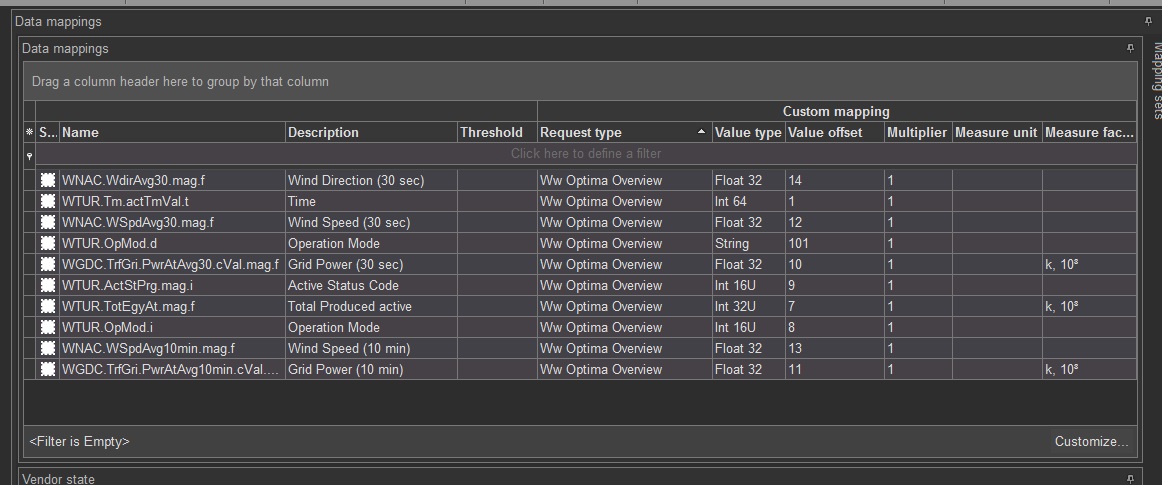
Each of the listed numbers defines a value offset in the specific request type
Ww Optima Overview request type:
Vendor state is a functionality in scope of the Data Class Editor tab allowing customers define the states of the units just the way they wish, including:
In this section we will instruct you on how to configure a number of specific vendor states for the wind turbines. For example, let's configure the following wind turbine states:
In order to configure a vendor state, take the following workaround step by step.
1. Press the  Vendor State icon on the toolbar to open the Edit vendor state(s) dialog. Alternatively, right-click within the Vendor State panel to open the context menu and select the Vendor state option.
As a result, the Edit vendor state(s) dialog reveals within the main monitoring area.
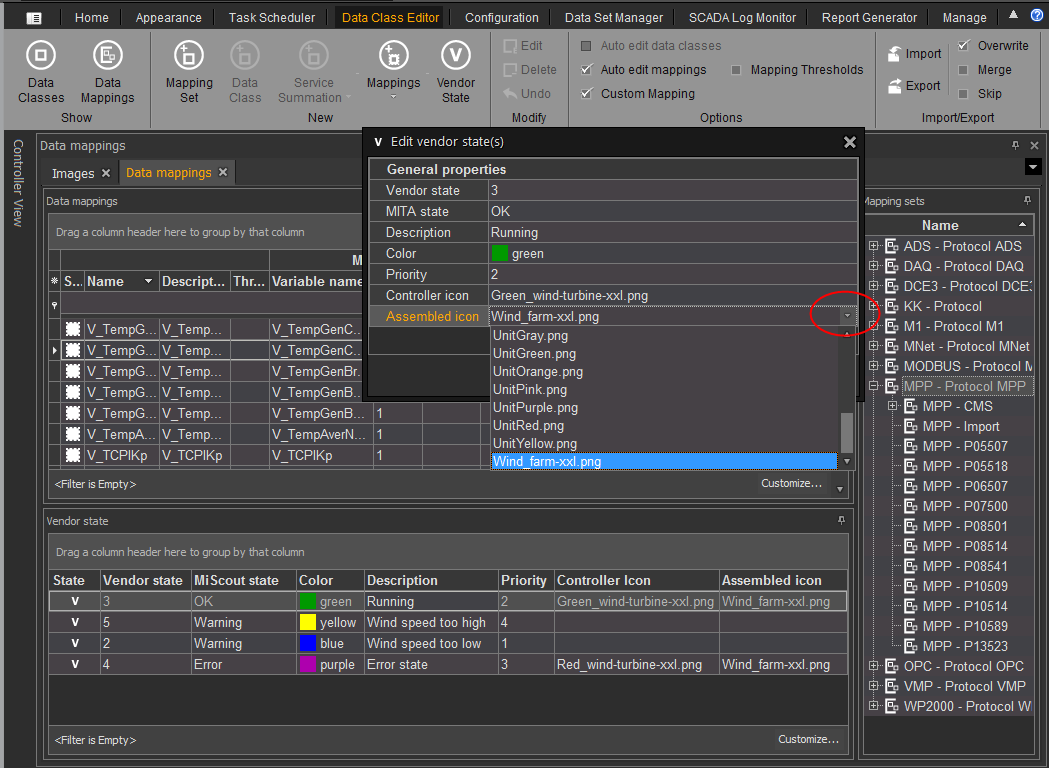
2. Configure the following property fields for the corresponding vendor state in the Edit vendor state(s) dialog:
General properties

Note. Mita states are pre-defined and hard coded in MiScout. These states are used by default, in case no user configured vendor states are currently available in the system.
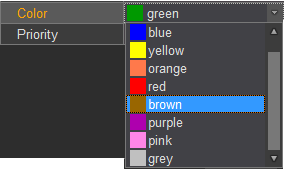
Note. Priority value is taken into account when defining a vendor state for the whole park of wind turbines. For example, if a number of turbines show different vendor states, the park icon will acquire the color defining the vendor state with the highest priority.
Note. For an image to be available on the drop-down list of Controller Icon and Assembled Icon property fields, it must be configured beforehand in the Images Configuration window. For more detail instructions, see the Images Configuration chapter.
3. On configuring all the property fields, press the OK button in the dialog.
4. Finally, to quickly apply the configuration changes click the  Commit Changes icon at the left top corner of the main application window. Otherwise, click the
  Rollback Changes icon to withdraw the changes.
All recently configured vendor sates will be displayed in the Vendor state panel (see the screen in step 1).
Adding data items
To show the configured unit states, one or multiple data items must be added to the corresponding data set in the Data sets panel. For example, in our specific case we have added several data items: e.g. Turbine state (0 - OK; 1 - Warning; 2 - Error) and Wind speed. Possible configuration of these data items is shown in the following screens.
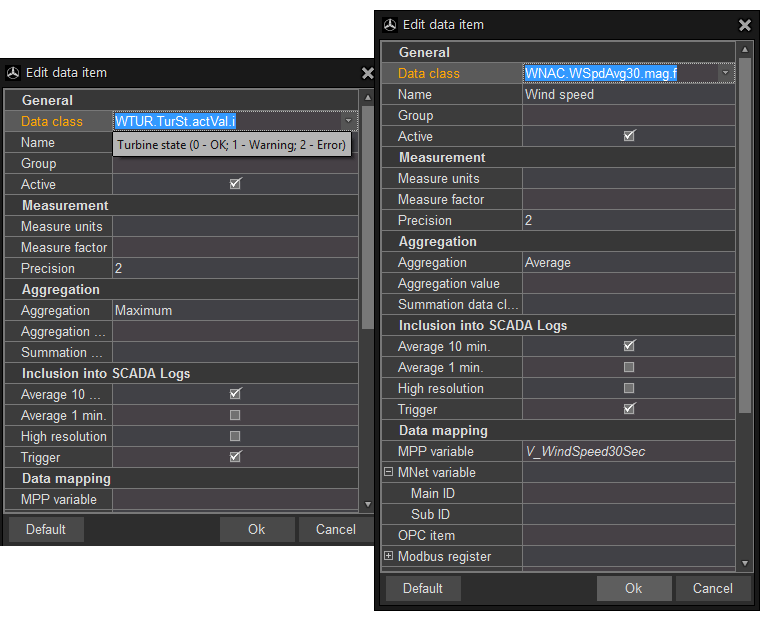
Configuring a threshold
On configuring all required vendor states and data items, the next step to take is creating a threshold. As soon as the threshold condition is fulfilled, the turbine icon will change its color according to configured vendor states.
Further in this section is shown possible threshold configuration, which will activate all prior configured vendor states (see Configuring vendor states described earlier in this section). For more detail instructions on creating and configuring thresholds, refer to Configuring Thresholds.
Besides, for the threshold to get activated based on pre-defined script conditions, we've created a special script called "Vendor_state_2.js" (see the script code on the screen below).
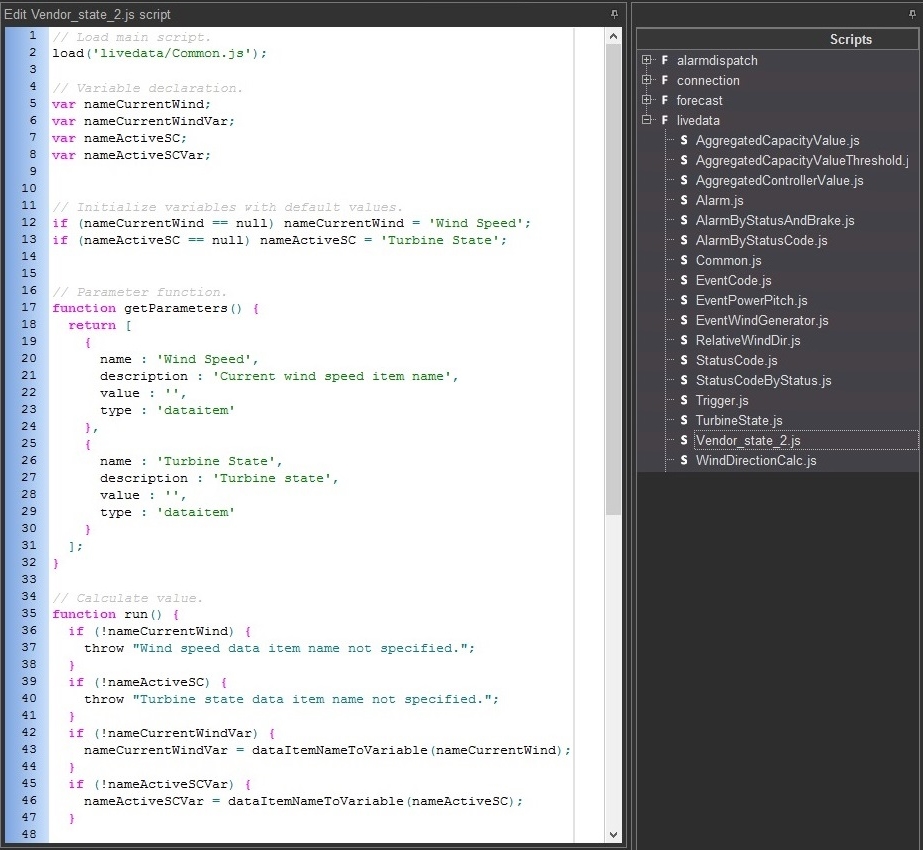
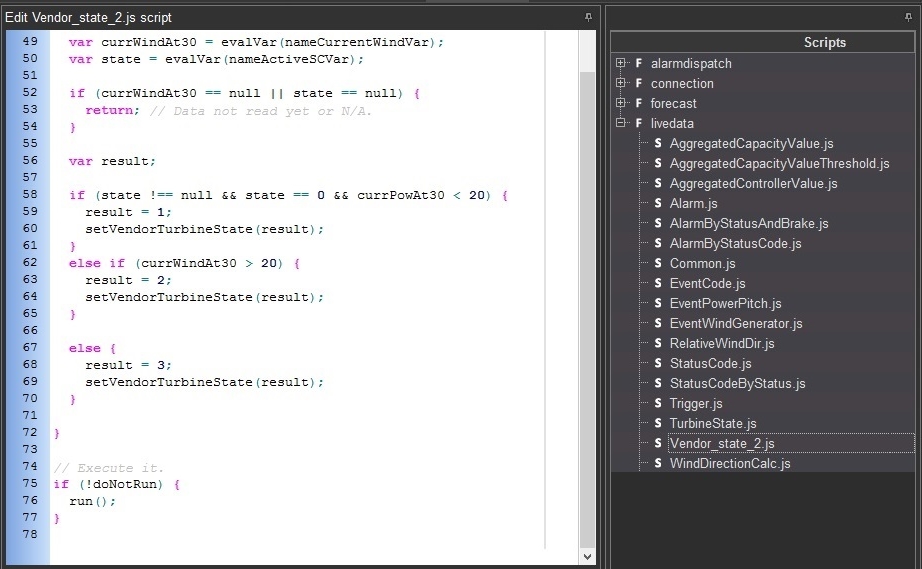
Please keep in mind, that "Vendor_state_2.js" is an example of a custom script, which users have to create and configure beforehand. For more detail instructions on creating and configuring scripts, refer to Scripts View.
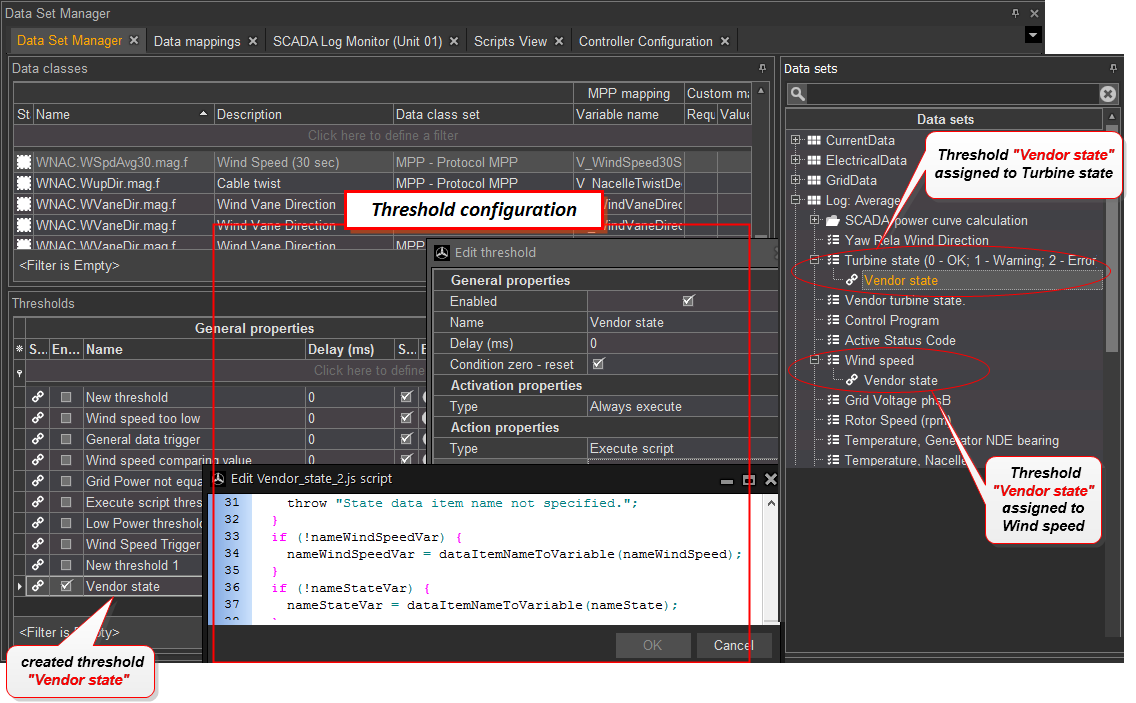
As seen in the screen above, we have taken the following configuration steps:
1. We've created a threshold called "Vendor state".
2. Next, we've configured the threshold properties as follows:
Note. In the Value field users can select any of the custom scripts with pre-set conditions to show different vendor states (for example, we've created a custom script "Vendor_state_2.js").
3. Reveal the Edit script dialog and make proper changes in the script as shown in the screen above and press OK.
4. Finally, to quickly apply the configuration changes click the  Commit Changes icon at the left top corner of the main application window. Otherwise, click the
  Rollback Changes icon to withdraw the changes.
5. Now that the threshold is configured, we can assign it to the data items in the Data sets panel. Therefore, select the threshold by clicking it and using drag-and-drop assign it to the corresponding data items (see the screen above).
6. After the threshold is successfully assigned to the data items, we will configure its parameters in the Parameters dialog as shown in the screen below.

As a result, Turbine state (0 - OK; 1 - Warning; 2 - Error) and Wind speed will be assigned in the Parameters dialog of the Vendor sate threshold.
7. To save final changes in the threshold, click the  Commit Changes icon at the left top corner of the main application window. Now the threshold will be enabled and executed in MiScout.
Viewing vendor states in MiScout
User can view all configured vendor states are in MiScout SCADA: for example, in MiScout Desk after opening the Home tab and pressing the Globe View icon on the toolbar (see the Home section for more information).
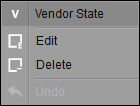
All configured vendor states can be easily removed from the system or can also be edited. To do this, user has to select the required vendor state and right-click it to open the context-menu.

In the revealed context menu click Edit to change the vendor state properties. To be able to remove a specific vendor state fro the system, select the Delete option.
In this section we will describe a step by step workaround of calculating thresholds in Data Class Editor. First of all, make sure that the Data Mappings icon has been activated so that the Thresholds icon in the Calculate section on the toolbar is enabled. Afterwards, take all the steps as described below.
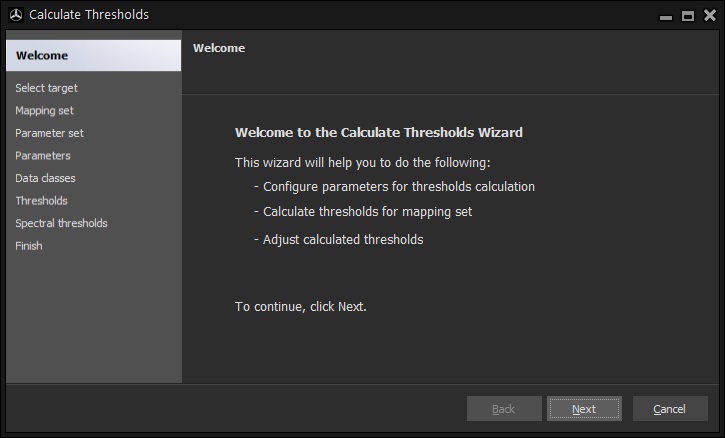
1. Press the Thresholds icon in the Calculate section on the toolbar to open the Calculate Thresholds Welcoming window. To proceed, press Next in the dialog window.
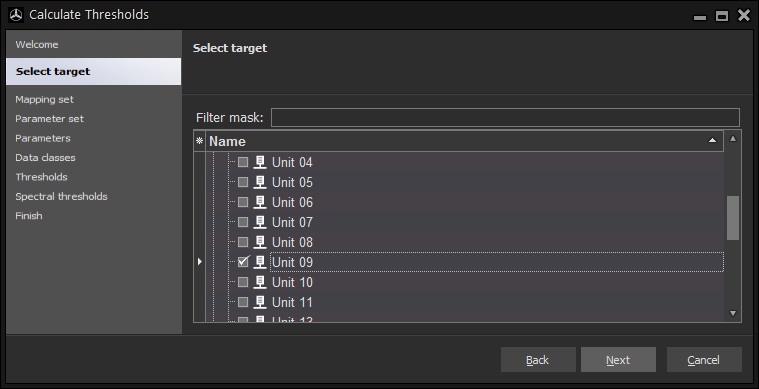
2. Select required controller(s) by selecting corresponding check-boxes and press Next to proceed.
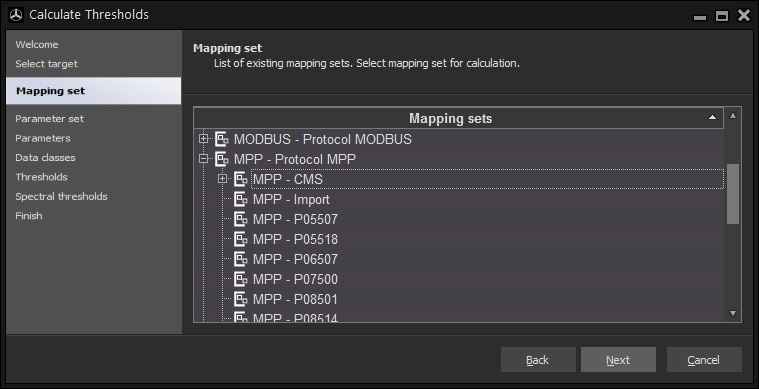
3. Specify the appropriate mapping set in the list and press Next to proceed.
4. Make proper parameter settings in the property fields displayed below.
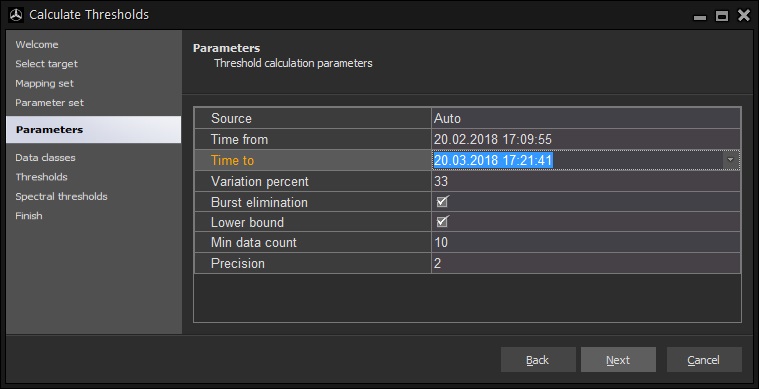
On making all settings, press the Next icon to move to the next window.
5. Specify the appropriate channels on the list by selecting corresponding check-boxes and press Next to proceed with the configuration..
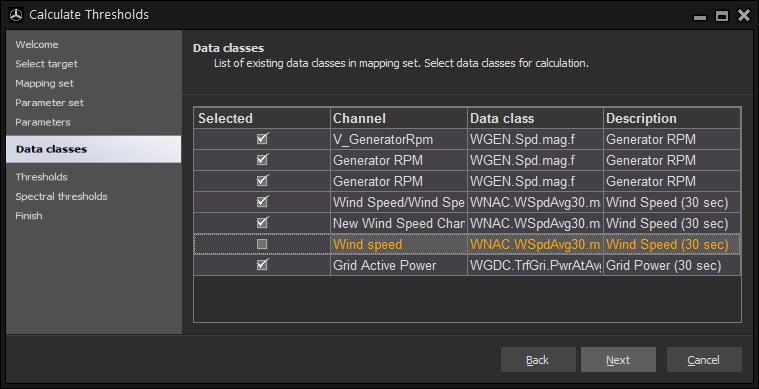
6. In the next window two tabs can be activated - Threshold or Status Page, each containing a specific set of icons and tools.
Under the Thresholds tab there are Warning coefficient and Alert coefficient property fields allowing a user to enter required values.
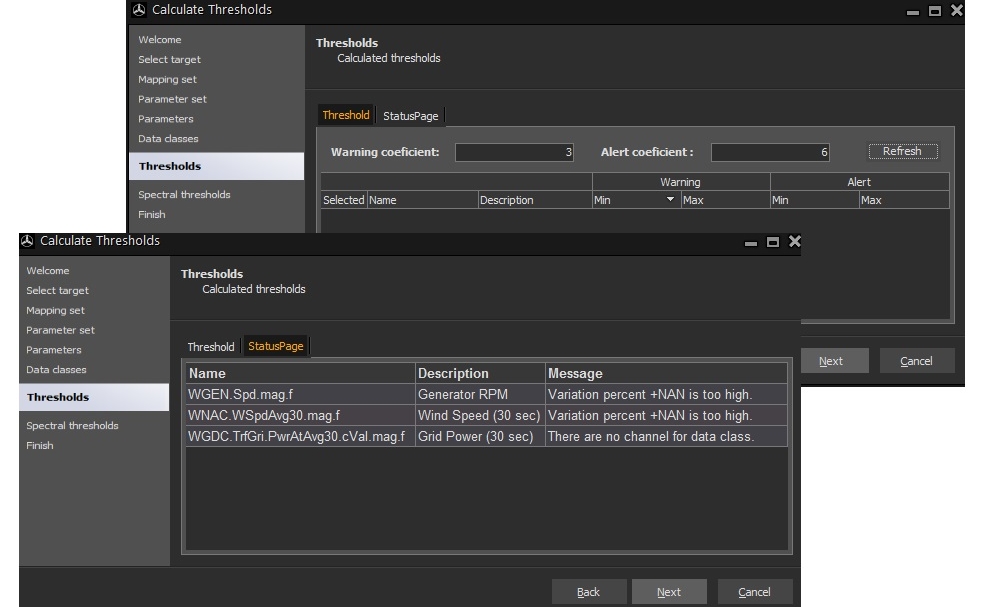
On pressing the Status Page tab appropriate information showing the status of calculated thresholds is displayed. On pressing Next, a user can move to the final configuration window.
7. Finally, press Finish to close the wizard and save the configuration.
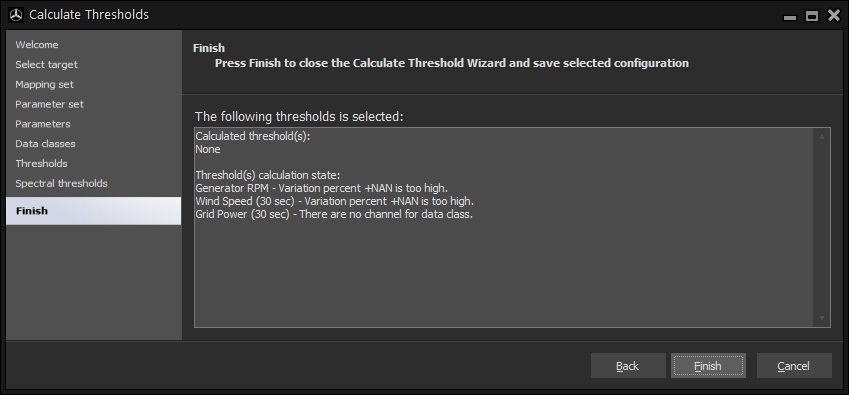
As already mentioned at the beginning of this section, with the help of the buttons residing in the Import/Export of the Data Class Editor toolbar a user can export mapping set data to the .csv file; as well as import new data to the mapping set from the .csv file. More detail instructions on how to perform data mappings import/export in Data Class Editor is described below.
Importing data mappings
Import of data mappings is one of the key features in Data Class Editor, as it allows a user to quickly configure required data mappings in MiScout SCADA Desk by way of importing necessary data from the .csv file. Therefore, in this section we will first dwell on data mappings import.
In Data Class Editor we can import data contained in the .csv file to one of the available mapping sets. Alternatively, a new blank mapping set can be created, to which new data will be added by way of importing data mappings from the .csv file.
1. First, you have to create a new blank mapping set. Therefore, right-click within the Mapping sets panel to open the context-menu and select the Mapping Set option.
2. Next, enter any suitable name for the new mapping set (e.g. OPC - My new mapping set). Finally, press the  Commit Changes icon to save new settings.
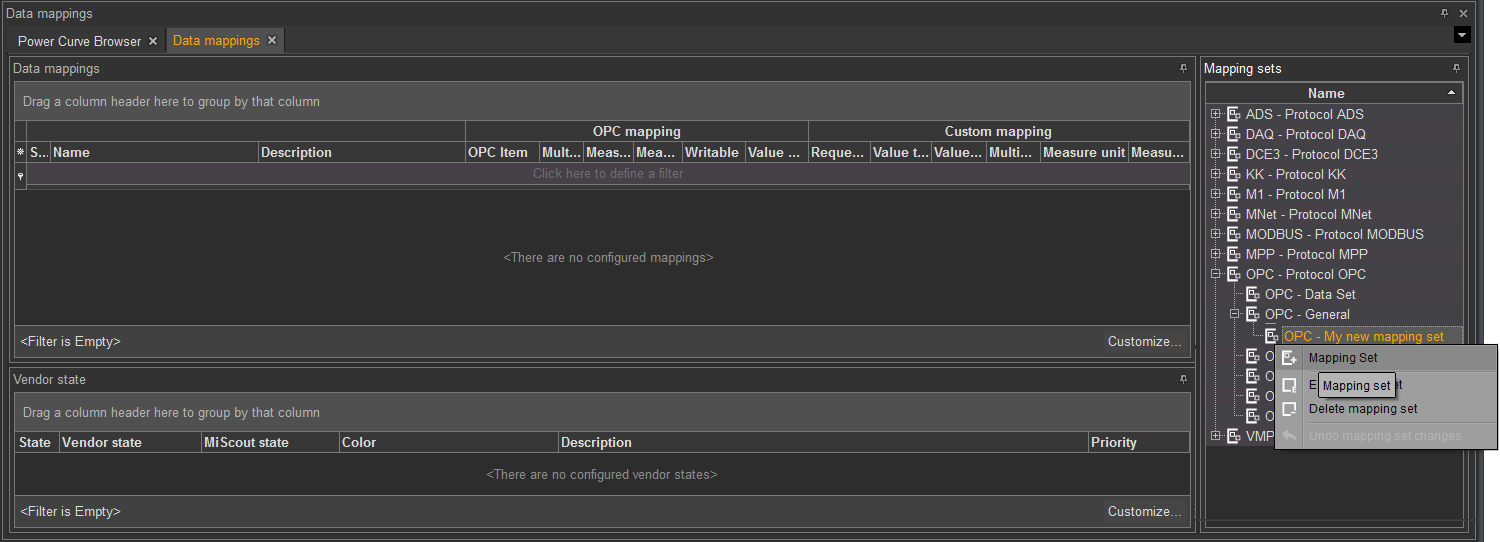
3. Select the mapping set in the Mapping sets panel to the right by clicking it.
4. Next, make some additional settings prior to importing:
In our specific case, we will select the Overwrite option.
5. Press the  Import icon residing in the he Import/Export section of the toolbar.
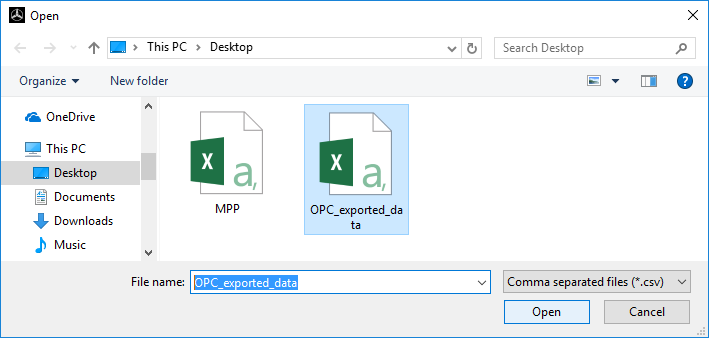
6. Browse to the location of the required .csv file, select it and press Open.
If done successfully, data from the .csv file will migrate to the selected mapping set. Please pay attention to the green icons next to the recently added data, meaning that the data is not saved yet. To proceed with saving data, press the  Commit Changes icon.
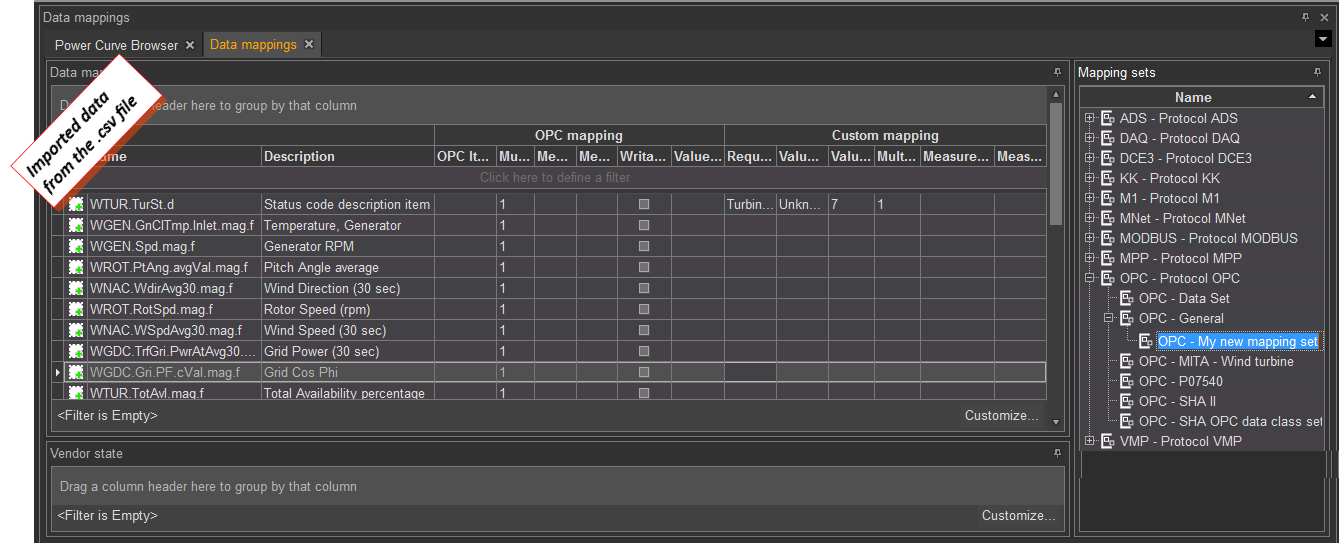
For quick configuration of data mappings, a user can create a special .csv file with data mappings, which later on can be imported to MiScout Desk. Below, you can find an example of the typical .csv file with MPP mapping.
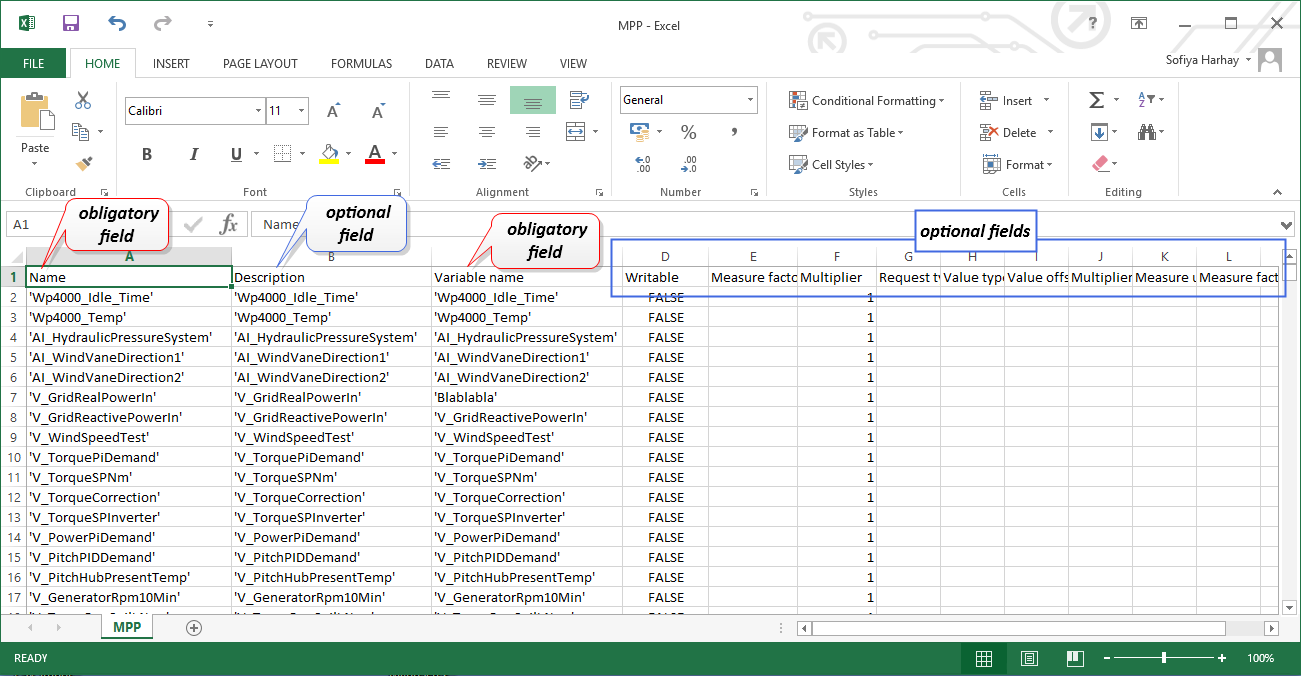
The picture above shows obligatory and optional fields for the MPP mapping. This means, that when creating a .csv file (to be further imported to the MPP mapping set), a user must necessarily enter proper values in the following fields, which are obligatory for this type of mapping. Whereas rest column fields are optional, so that they can be skipped and left blank when writing data mappings into the .csv file. In the table presented below you will find a list of obligatory column fields for each specific data mapping.
|
|||
|---|---|---|---|
| MPP mapping | Name, Variable name | ||
| ADS mapping | ADS Port, Variable name or ADS Port, Group, Offset | ||
| DAQ mapping | Name, Aggregation type | ||
| DCE3 mapping | Name, Request type | ||
| KK mapping | Name, Request type | ||
| M1 mapping | Name, Variable name | ||
| MNet mapping | Name, Main Id, Sub Id | ||
| MODBUS mapping | Name, Start address, Data type | ||
| OPC mapping | Name or Name, OPC Item | ||
| VMP mapping | Name, Request type | ||
| Custom mapping | Name, Request type | ||
Note. If available in the .csv file, custom mapping can be simultaneously imported with the following mapping types: MPP mapping, ADS mapping, DAQ mapping, M1 mapping, MNet mapping, MODBUS mapping, OPC mapping.
Note. Custom mapping is not allowed to be simultaneously imported to MiScout Desk with the following mapping types: DCE3 mapping, KK mapping, VMP mapping.
Exporting data mappings
For exporting the mapping set data to the .csv file, take the steps as described below.
1. Select the mapping set in the Mapping sets panel to the right by clicking it.
2. Press the  Export icon residing in the he Import/Export section of the toolbar.
3. Browse to the location of the required .csv file, select it and press Save.
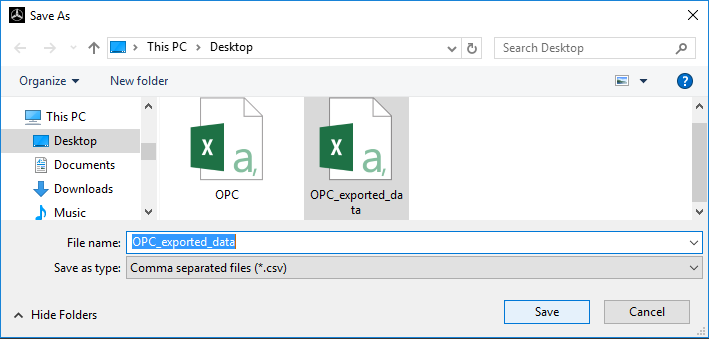
If done successfully, new data will be saved to the .csv file. After opening the .csv file, you can see its data, which differ depending on the selected mappings type (see the example of the .csv file with mapping in Creating a csv file for various mapping types.