

|
The Trigger log enables you to view the parameter values when alarm situation has occurred. Trigger Log contains specific pieces of information stored during alarm situation which just made the trigger to "fire" - i.e. pre-trigger and post-trigger information.
To enable SCADA Trigger Log monitoring, please, select the corresponding script (livedata\Trigger.js) in the Action Properties section of the Edit Threshold form while threshold configuration. For more detail information, refer to Configuring Thresholds for SCADA Logs monitoring and the Scripts View section.
1. Click the New icon available in the Window section of the toolbar to open the Operational Logs Browser window.
2. Afterwards, select the appropriate controller in the Controller View panel to the left of the main window.

3. Next, click Vendor or SCADA icon in the Trigger Log section on the main toolbar.
As a result, the Communication Log will show appropriate messages ensuring that communication with the selected controller has been established. Besides, the Channels panel will appear to the right displaying a list of channels available for this log type.
4. The list of available Triggers will reveal to the right part of the main monitoring area in the Triggers panel. Triggers with most recent time stamps will be selected by default. Therefore, select Triggers you'd like to see in the log. Also, specify required channels by selecting corresponding check-boxes.
Additionally, Filter mask can be used for a comfortable and quick search for the required channels based on the channel name. To view the selected channels, select the Checked Only check-box.
5. To proceed, specify the time period for the log to be generated using desirable tools provided by the Time selector.
6. Eventually, press the Start button to launch the log generation process.
Finally, the log data will be shown in Operational Log Browser.
The Data window in the Chart view gives a graphical presentation of the pre-trigger and post-trigger information as well as the trigger itself, which is marked by a vertical line.
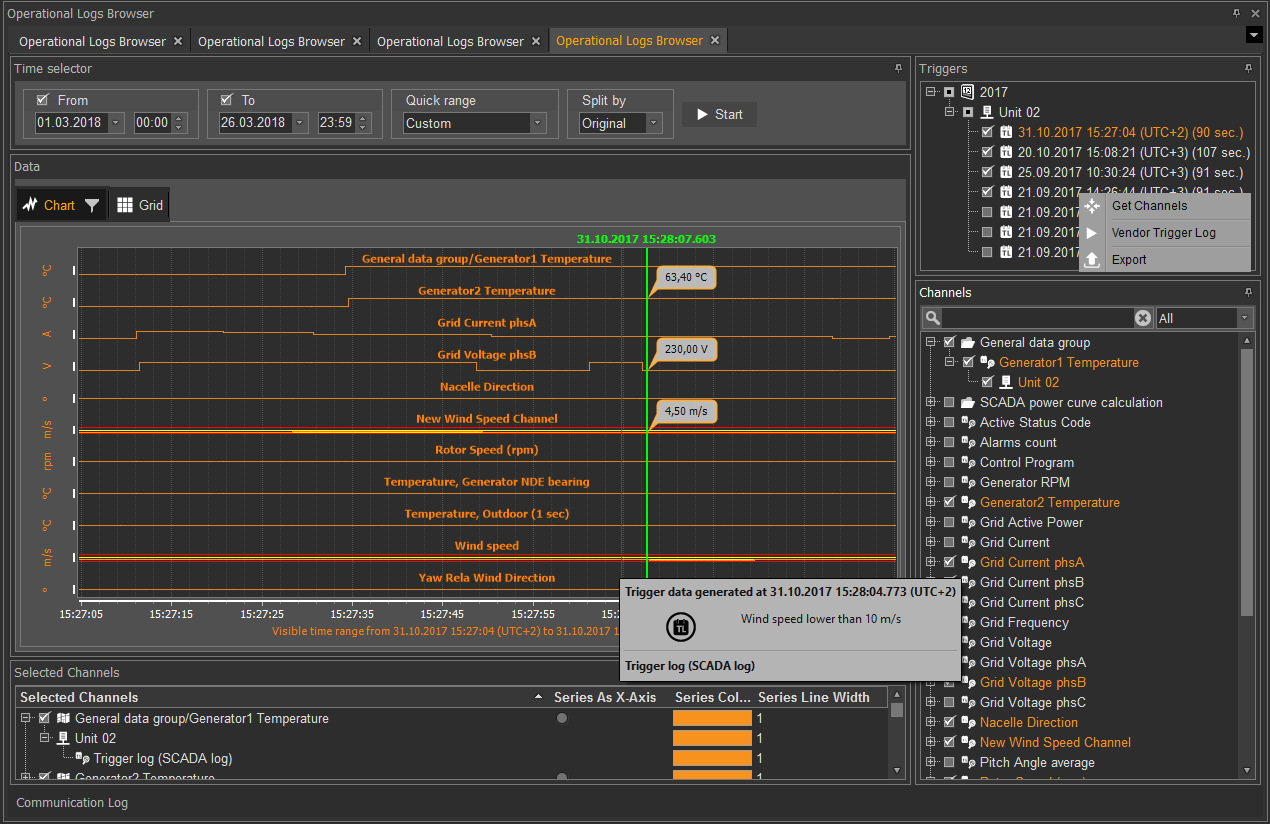
The Selected Channels section provides a possibility to customize the Chart appearance. You can adjust the desired look by setting the following parameters: enable Series As X-axis; pick Series Color in the drop-down menu, set Series Line Width and choose Series Type for each channel.
Note. Channel lower/upper values to specify the threshold range must be preliminary configured in data mapping. For more information, see custom mapping in the Data Class Editor section.
To zoom in the required part of the graph make a selection with the cursor in the direction from the left to the right, it is possible to zoom in several times thus enlarging the picture more and more. To zoom out a selection in the opposite direction - from the right to the left - should be made. Zooming out is performed just once and returns the view of the window to its original scale.
Trigger Log in a Grid view gives numerical presentation of pre-trigger and post-trigger information.
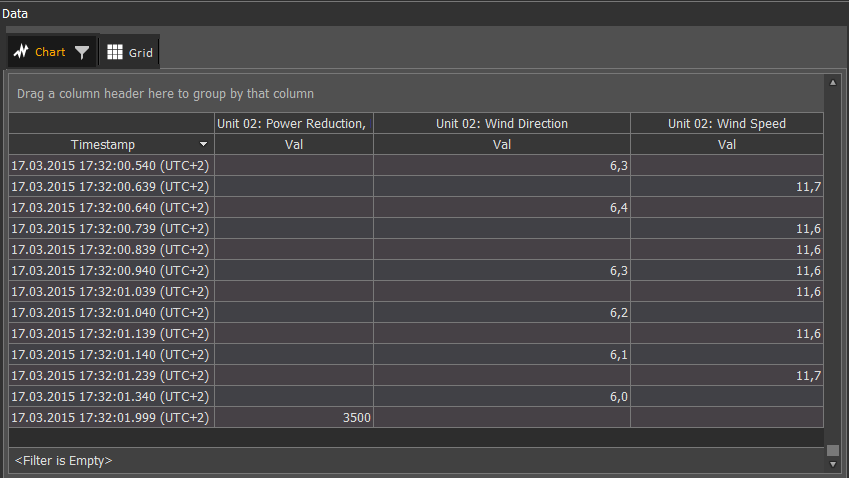
The Data window in the Grid view consists of several columns informing you on the Timestamp, which indicates the moment of time when the status code has been set. You can view information on several triggers selecting them in the Triggers tree located in the upper-right corner. The following columns preset pre-trigger and post-trigger information of the selected Channels. You can select the Channels just below the Triggers tree. Filter mask can be used for a comfortable and quick search based on the Channel name.
On right-clicking a selected trigger, a user can open a contextual menu (see the main screen above) containing the following menu options:
Note. To have the Export icon enabled in the contextual menu, make sure that the Importer (mtplImporter.bpl) plug-in is listed in the Plugin Configuration dialog (see Configuring Plug-ins.for more details).
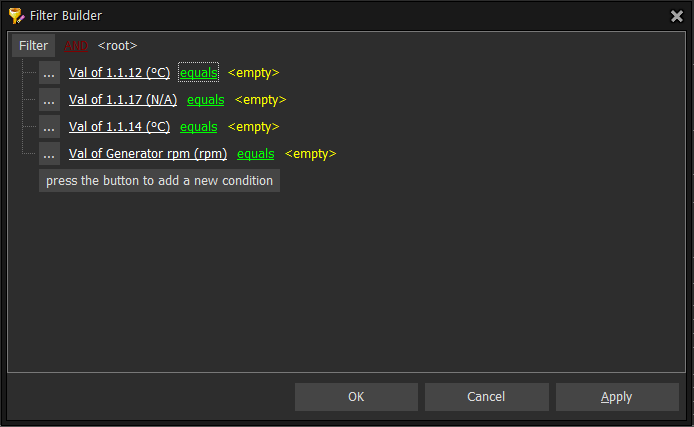
Besides, MiScout Desk allows to filter channels in each columns of the grid using the  filter icon found next to the column name. So, all you need, is to select the required options in the revealed drop-down menu. You can also configure a grid filter by clicking the Customize...
  icon.
icon.
Upon clicking the  Filter icon you can easily customize the process of filtering by setting the required parameters and conditions.
Viewing and saving log data as an Excel (.xls) file
For user's convenience, all controller data shown in the Operational Logs Browser can be viewed and saved as an Excel (.xls) file. For more detail instructions, refer to Viewing and saving log data as an Excel (.xls) file described in Vendor Standard Average Log.
HDF5 (Hierarchical Data Format, Version 5) is a special file format (.h5) designed to store and organize large amounts of data.
It is important to mention, that HDF5 files can also be used in MATLAB.
As soon as the Trigger Log (both Vendor and SCADA) is generated, log data can be exported and saved in the HDF5 (.h5) file format. To do this, follow the workaround as described below.
1. Press the ![]() Save to HDF5 icon residing in the Export section of the toolbar.
Save to HDF5 icon residing in the Export section of the toolbar.
2. Specify the path to the directory for storing the .h5 files by selecting the desired root folder. Press OK, to confirm your choice.
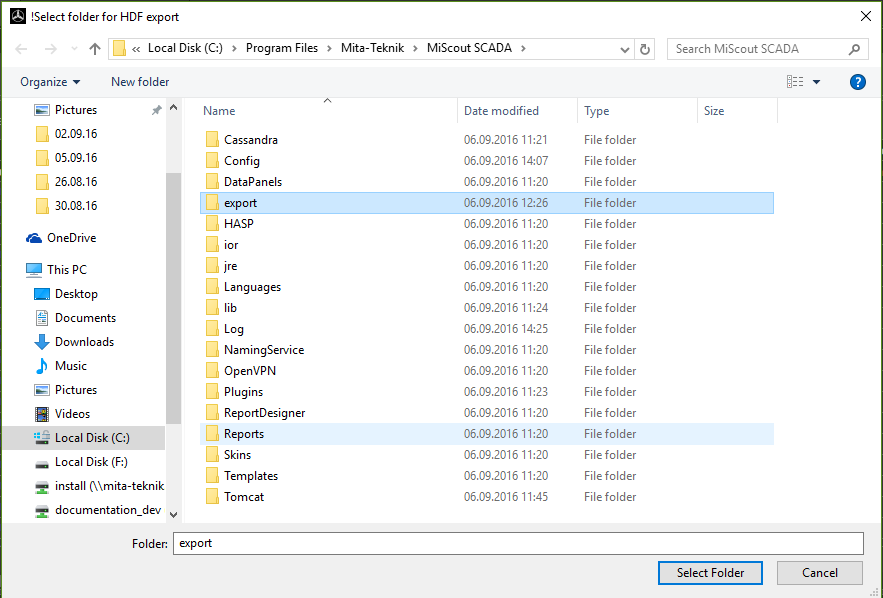
Note. Please keep in mind, that each trigger prior selected for generating a Trigger Log will be exported to a separate .h5 file. Therefore, the system will create as many .h5 files, as many triggers have been selected for the log generation.
When created, all .h5 file bear complicated names like "TL_Site_Plant_Turbine_TriggerStartDate_TriggerStartTime_TriggerEndDate_TriggerEndTime.h5".
This name is made up of multiple components separated by the underscore ("_"), each component meaning the following:
TL - Trigger Log;
Site - Parent site, where the controller is located.
Plant - Parent plant, where the controller is located.
TriggerStartDate - Trigger activation date.
TriggerStartTime - Trigger activation time.
TriggerEndDate - Trigger deactivation date.
TriggerEndTime - Trigger deactivation time.
3. If the directory already contains .h5 file(s) with the same name(s), the following Confirm dialog will appear.

Depending on your needs, press the corresponding button in the Confirm dialog, which will result in the following:
Yes - specified .h5 file (its name is shown in the Confirm dialog) will be overwritten.
No - new .h5 files won't be created, thus older .h5 files will be kept instead.
Yes to All - all .h5 file(s) will be overwritten with the new one(s).
On pressing Yes or Yes to All, the operation progress is shown as percentage values in the Progress field of the State section on the toolbar.

If done successfully, all .h5 files recently created by the system will be available in the specified directory (see Step 2 above).
To enable automatic HDF5 data export, refer to HDF5 data export described in the Service Actions section found under the Task Scheduler chapter.
Description of HDF5 file structure
HDF5 key advantage is that it simplifies the file structure by including key object types:
Below you can find the HDF5 file structure for the Trigger Log (both Vendor and SCADA) in more detail.
Key definitions
Working with groups and datasets is similar in many ways to working with directories and files in UNIX. As with UNIX directories and files, an HDF5 object in an HDF5 file is often referred to by its full path name (also called "an absolute path name").
/ signifies the root group.
/Site signifies a member of the root group called Site.
/Site/Park signifies a member of the group Site, which in turn is a member of the root group.
The screen bellow shows the structure of the HDF5 file containing information on triggers.
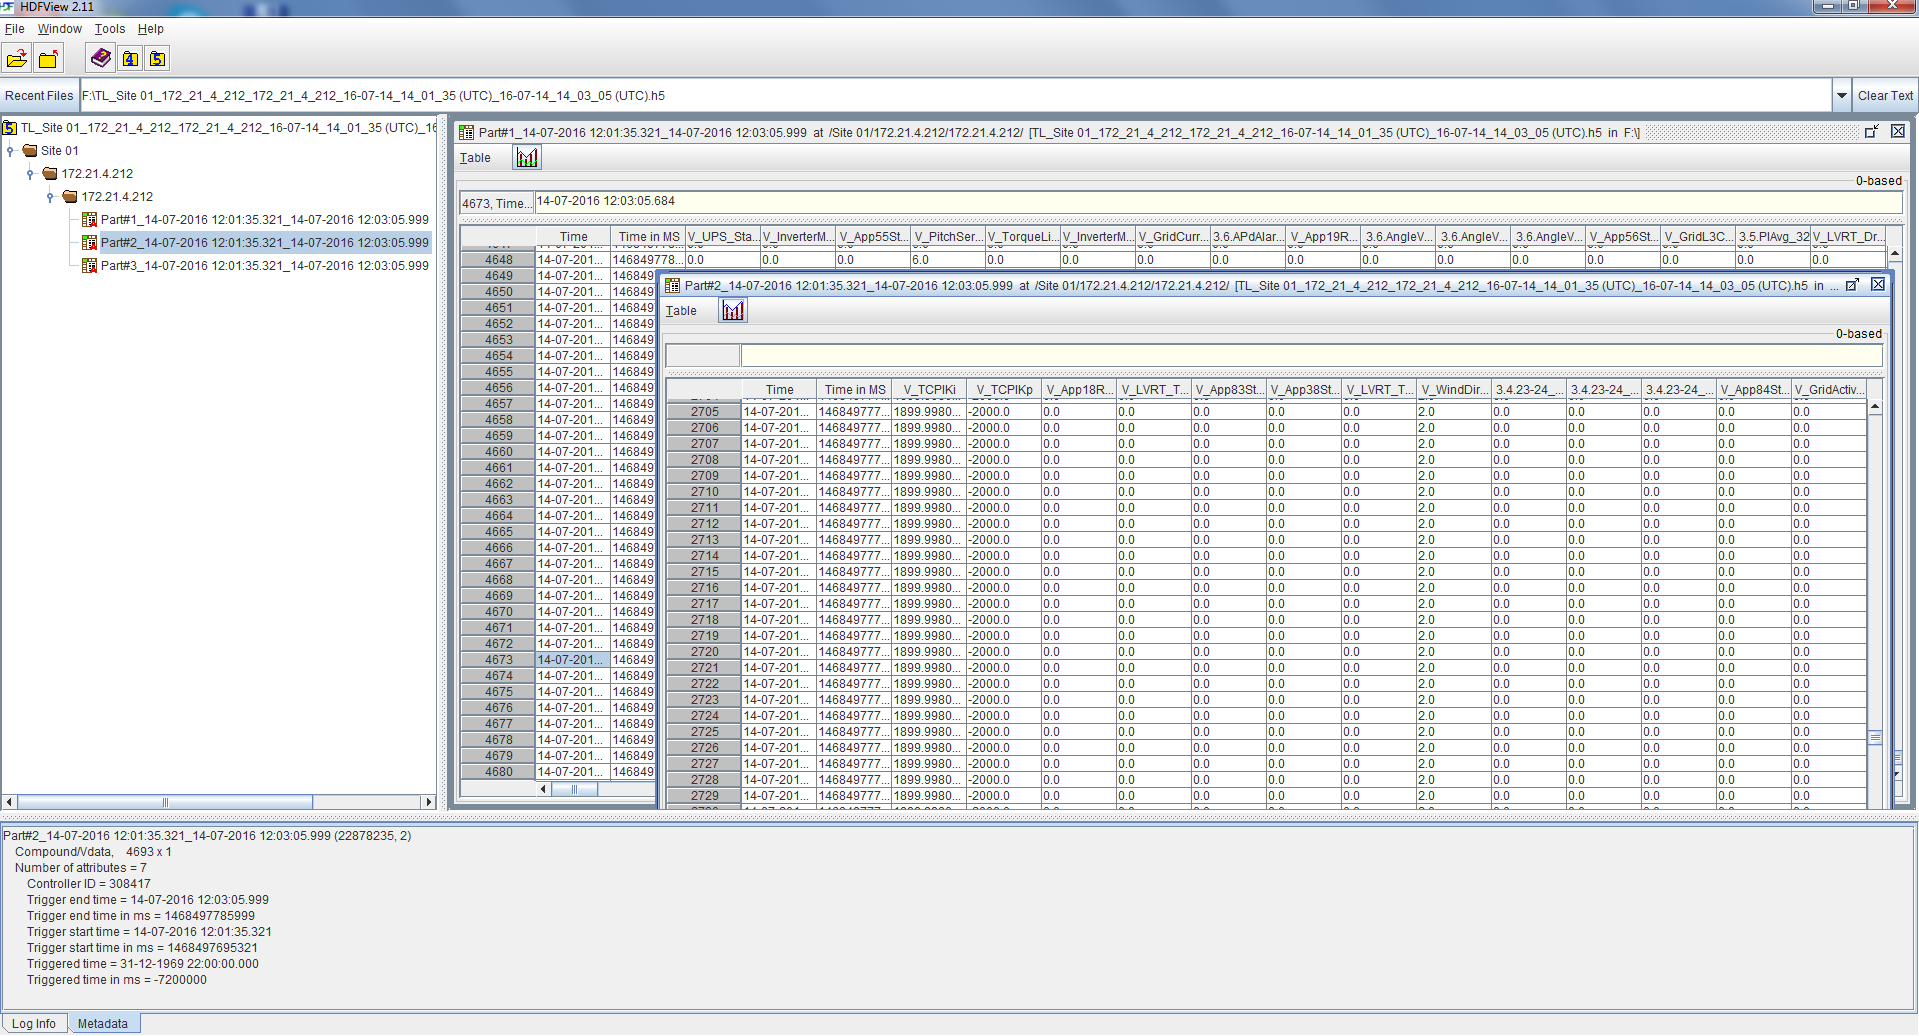
Please pay attention to the three DataSets to the left of the screen. This can be explained by around 1500 channels available in the Trigger Log. For more detail information, see the Note below.
Note. In case the number of Trigger Log channels exceeds 900 items, data are split into a number of DataSets each containing the maximum number of 900 channels.
Each generated HDF5 (.h5) file consist of Groups and Datasets, where
For example, in MiScout Desk (Client) the path looks like “Site -> Park -> Cluster -> Controller”. As a result, in the HDF5 file we will have the following groups:
“Site -> Park -> Cluster -> Controller”.
Each Group can hold multiple Groups or Datasets. AGroup can also contain several TriggerLogs (Datasets).
Columns: Time (with precision to ms.), Channel1, Channel2,… .
Column "Time" – controller time with precision to seconds, format “17.10.16 16:55 48s”.
Column “Time in MS” – controller time with precision to milliseconds, format “1234651484657”.
Note. If no information is available, "0.0" values are shown in the channel columns by default.
On clicking the Metadata tab at the lowest left corner of the window, the corresponding dialog containing the list of attributes appears:
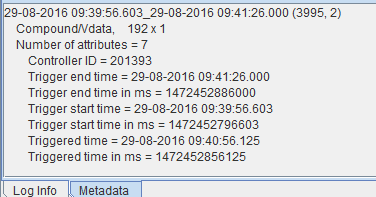
More detail information on all datasets attributes (i.e. additional information about the trigger log) is presented in the table below:
|
|||
|---|---|---|---|
| Controller id | Some id (int) | ||
| Trigger start time (controller time) | String 21.07.16 16:55 | ||
| Trigger end time (controller time) | String 17.11.16 16:55 | ||
| Triggered time (controller time) | String (with precision to seconds (s), e.g. 17.10.16 16:55 48s) | ||
| Trigger start time ms (controller time) | Long (with precision to milliseconds (ms), e.g. 1476723360000ms) | ||
| Trigger end time ms (controller time) | Long (with precision to milliseconds (ms), e.g. 1476723360000ms) | ||
| Triggered time ms (controller time) | Long (with precision to milliseconds (ms), e.g. 1476723360000ms) | ||
| Description | String | ||