|
|
With the help of the Turbine Service tab in MiScout SCADA a user can get access to the following types of logs:
To access the Turbine Service tab in MiScout SCADA, Turbine Service (mtplTurbineService.bpl) plug-in is required. Therefore, first of all, make sure that the required plug-in is already listed in the Plugin Configuration dialog.
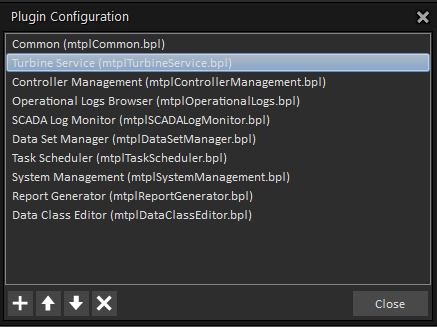
If the required plug-in is available, the Turbine Service tab will appear on the main application ribbon. In case the required plug-in is not on the list, user can easily upload it. For more detail information, refer to Configuring Plug-ins.
As soon as Turbine Service (mtplTurbine Service.bpl) has been loaded, the Turbine Service tab becomes available on the main application ribbon. Therefore, click the Turbine Service tab to open this functionality.
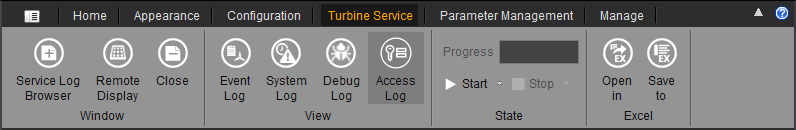
As a result, the Turbine Service main toolbar appears. As you can see, the View section of the main toolbar displays all types of logs, which can be generated using the Turbine Service functionality.
The Event log in Turbine Service is designed to react on certain predefined events (being determined by a controller firmware) by making corresponding entries into the Event Log. A new entry into the log will also be made when a status code is set or cleared. Further on, this information is normally used by Mita developers for troubleshooting, debugging purposes, etc.
Please keep in mind, that Event Log provided by Turbine Service is available for the following controller types:
For more detail information on Event Log in MiScout SCADA, refer to Event Log described in Operational Log Browser.
Independent of the Turbine Service log type, some basic steps have to be taken by a user to generate the log. In our specific case, we will show you how to generate the Even Log serving as an example for creating other log types.
Basic steps for generating all types of Turbine Service logs
1. First of all, select the required controller in the Controller View panel.
2. Afterwards, press the New button found in the Window section of the Turbine Service main toolbar. As a result, all icons of the View section become enabled. Also, a blank Turbine Service Logs dialog opens displaying Communication Log at the bottom.
3. Press the ![]() Event Log icon residing in the View section on the main toolbar.
Event Log icon residing in the View section on the main toolbar.
4. Set the appropriate time range for the log data in the Time selector panel as shown below.
5. Finally, to view the log for the selected controller(s), press Start.
When the data are in the process of retrieval either from the controller or from the database, the Progress bar in the State section informs about log completion in percentage values. Besides, user can easily interrupt the process by pressing the Stop button. As soon as data retrieval is finished, the Stop icon is no longer available.

Event Log can be finally viewed within the main monitoring area.
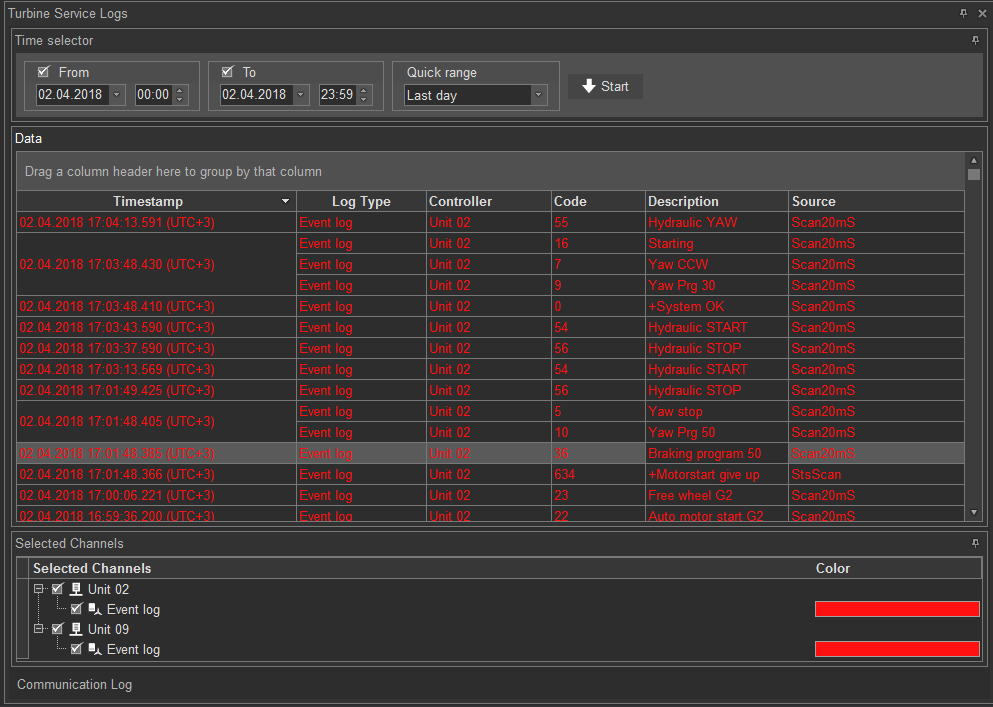
Let's take a closer look at the Event Log window. As you can see, one more tab appeared at the bottom called Selected Channels. It gives information on the selected controller as well as the log type currently presented onscreen.
As you can see on the above screen, data contained in Event Log are grouped, by default, under a number of the following columns:
Viewing and saving log data as an Excel (.xls) file
For user's convenience, all controller data shown in the Operational Logs Browser can be viewed and saved as an Excel (.xls) file. For more detail instructions, refer to Viewing and saving log data as an Excel (.xls) file described in Vendor Standard Average Log.
The System Log in Turbine Service holds key information received from Mita controller operating system as well as other applications running on this controller type. Further on, this information is normally used by Mita developers for troubleshooting, debugging, etc.
Please keep in mind, that System Log provided by Turbine Service is available exclusively for Mita Controllers.
As mentioned earlier in his chapter, independent of the Turbine Service log type, user has to take some basic steps to view the log on the screen. For more detail information, refer to Basic steps for generating all types of Turbine Service logs mentioned earlier in this chapter.
The only difference makes Step 3, where a user has to press the ![]() System Log icon.
System Log icon.
After successful fulfillment of all the necessary steps, user can view System Log within the main monitoring area.
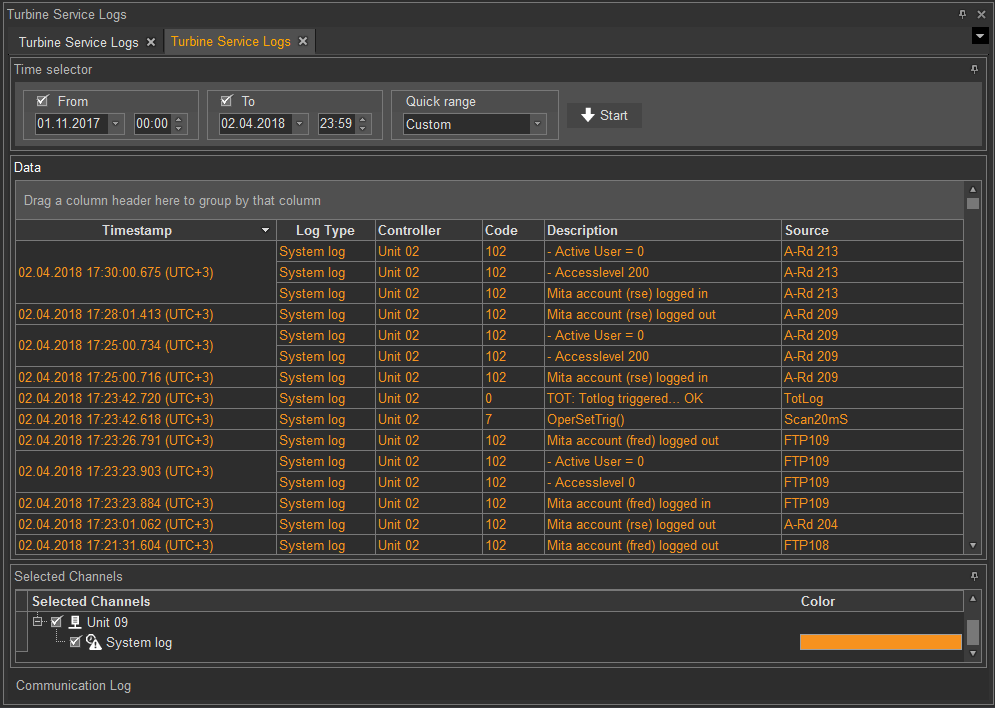
As seen on the above screen, data contained in System Log are grouped, by default, under a number of the following columns:
Viewing and saving log data as an Excel (.xls) file
For user's convenience, all controller data shown in the Operational Logs Browser can be viewed and saved as an Excel (.xls) file. For more detail instructions, refer to Viewing and saving log data as an Excel (.xls) file described in Vendor Standard Average Log.
The Debug Log in Turbine Service provides information on Mita controller internal debugging purposes. Further on, this information can be used by Mita developers for troubleshooting, debugging, etc.
Please keep in mind, that Debug Log provided by Turbine Service is available exclusively for Mita Controllers.
As mentioned earlier in his chapter, independent of the Turbine Service log type, user has to take some basic steps to view the log on the screen. For more detail information, refer to Basic steps for generating all types of Turbine Service logs mentioned earlier in this chapter.
The only difference makes Step 3, where a user has to press the ![]() Debug Log icon.
Debug Log icon.
After successful fulfillment of all the necessary steps, user can view Debug Log within the main monitoring area.

As seen on the above screen, data contained in Debug Log are grouped, by default, under a number of the following columns:
Viewing and saving log data as an Excel (.xls) file
For user's convenience, all controller data shown in the Operational Logs Browser can be viewed and saved as an Excel (.xls) file. For more detail instructions, refer to Viewing and saving log data as an Excel (.xls) file described in Vendor Standard Average Log.
The Access Log in Turbine Service provides information on Mita controller internal events like who and when logged on the unit, either remotely or locally on site. The Access Log can also contain information from the Parameter Log, as the system automatically loads data from all logs available on the target controller for the specified time range. Parameter Log gives users a simple historical overview of all parameter changes taking place on the target controller. The log enables users to trace parameter changes back in time and thereby secure the necessary documentation for professional traceability and error handling. Every moment a parameter is changed, two entries are made to the log - one containing the parameter name, and the second one - the new parameter value. Additionally, user information is available as Parameter Log is presented together with the Access Log in the Turbine Service Logs window.
Note. Access Log provided by Turbine Service is available exclusively for Mita Controllers.
To be able to view most-up-to-date controller data in the Access Log window, we recommend making some preliminary settings in the Appearance tab, by accessing the Appearance toolbar and configuring Data Settings options on the toolbar by selecting Along with online for the Data Source property field.
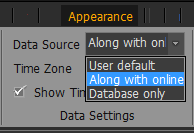
Selecting another option, which is Database only , means that the log data shown on the screen have been downloaded from the database. Therefore, this data can be a little bit outdated, if compared with the current timestamp.
As mentioned earlier in his chapter, independent of the Turbine Service log type, user has to take some basic steps to view the log on the screen. For more detail information, refer to Basic steps for generating all types of Turbine Service logs mentioned earlier in this chapter.
The only difference makes Step 3, where a user has to press the Access Log  icon.
icon.
After successful fulfillment of all the necessary steps, user can view Access Log within the main monitoring area.
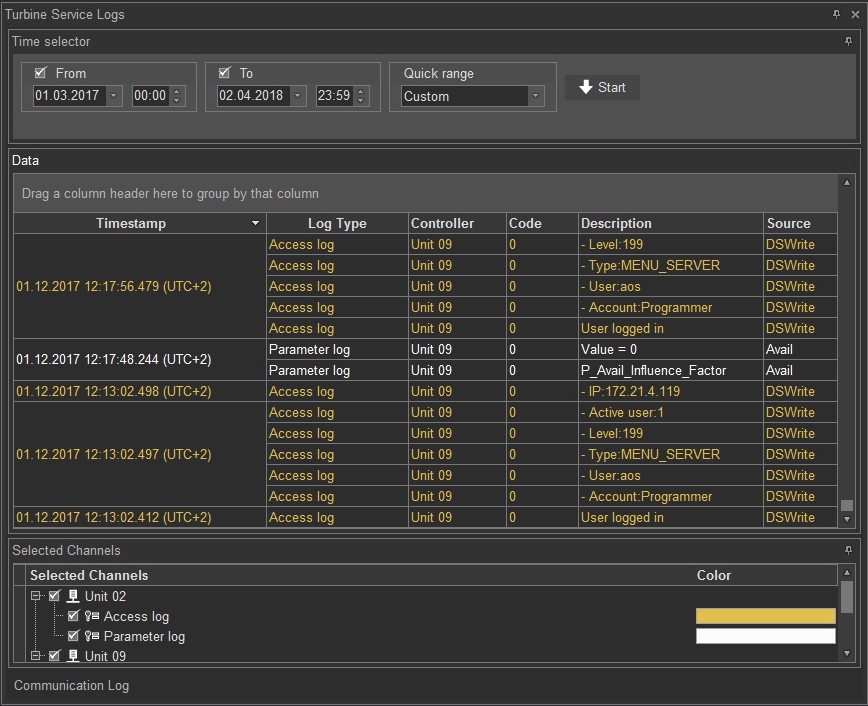
As you can see, the Turbine Service Logs window presents both Access Log an Parameter Log data retrieved from the target controller. The information is presented as a table containing the following columns:
Viewing and saving log data as an Excel (.xls) file
For user's convenience, all controller data shown in the Operational Logs Browser can be viewed and saved as an Excel (.xls) file. For more detail instructions, refer to Viewing and saving log data as an Excel (.xls) file described in Vendor Standard Average Log.