|
|
The purpose of the Operational Logs Browser is to enable the service personnel to monitor wind turbine parameters, thus helping them to setup and optimize its components. Operational Logs Browser provides an instant access to historical data, informing how the turbine responds to all external and internal conditions and influences.
MiScout Desk provides a possibility to see data according to the Data Source and Time Zone parameters set in the Appearance tab.
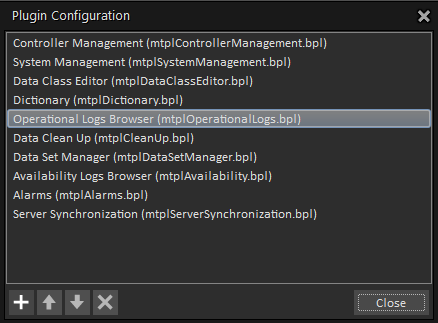
To be able to use Operational Logs, the Operational Logs Browser (mtplOperationalLogs.bpl) plug-in is required. Therefore, first of all, make sure that it is already listed in the Plugin Configuration dialog.
For more detail information, refer to Configuring Plug-ins.
As soon as the required plug-in has been loaded to Plugin Configuration, the Operational Logs tab appears on the main application ribbon. Therefore, click the Operational Logs on the ribbon to open its toolbar.
As you can see, the following types of logs are available for viewing on the Operational Logs toolbar:
User is free to decide whether to view each log as a Vendor log or as a SCADA log.
The CMS section of the toolbar contains special icons for loading the following types of logs:

The Average Log enables you to get data from the controller on such general parameters of the wind turbine operation as rotor and generator rotational speeds, oil pressure in gearbox, controller idle time, etc. aggregated by certain time period (usually it's a 10 minutes' period). As a result, minimal, maximal, average and standard deviation values will be calculated for each parameter (channel) every 10 minutes' interval.
24h Log and 36h Log are special log types supported by MNet controllers only. These log enable data retrieval from the controller on general parameters of the wind turbine operation averaged over 10 min intervals. Controller's memory allows storing data collected for over 24 hours/36 hours' period what just explains the name of the 24h Log/36h Log itself.
The High Resolution Log contains the online data for a long period of time (e.g. years). By default, values are sampled once per second. However, if required, this sampling rate can be increased.
The Trigger Log presents a user with the parameter values when alarm situation has occurred. Trigger Log contains specific information stored during alarm situation which just made the trigger "fire" - that is pre-trigger and post-trigger information.
In the Status Log a new entry is made when a status code is set; when status code is being cleared, an update of the previously logged data is made, so that each log line holds information on both status code setting and clear time stamps.
The Event Log is designed to react on certain pre-defined events (determined by controller firmware or configured on the SCADA side) by making correspondent entries into the log.