
|
Production Log displays aggregated data of the wind turbine power production over a specified time period.
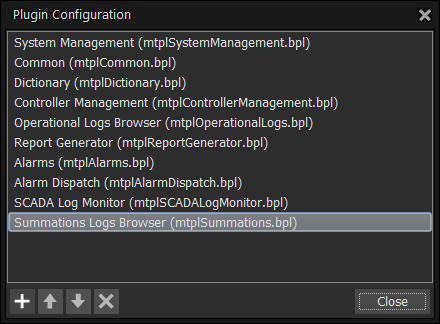
To reach the Production log tab, a user has to open the Summations tab on the MiScout main ribbon. Therefore, first a user has to make sure, that the Summations Logs Browser (mtplSummations.bpl) plug-in is already listed in the Plugin Configuration dialog.
If the required plug-in is available, the Summations tab will appear on the main application ribbon. In case the required plug-in is not on the list, user can easily upload it. For more detail information, refer to Configuring Plug-ins.

As soon as the corresponding plug-in has been added to Plugin Configuration, the Summations tab becomes available on the main application ribbon.

To begin with, first click the Summations tab on the main ribbon to open its toolbar. Next, press  New residing in the Window section on the toolbar. As a result, the Summations Browser window reveals within the main monitoring area. Also, you have to select a target controller in the Controller View panel to the left-hand corner of the main monitoring area. Now, go back to the Summations toolbar and select the required data source for the Production Log, which can be either Vendor or SCADA protocols.
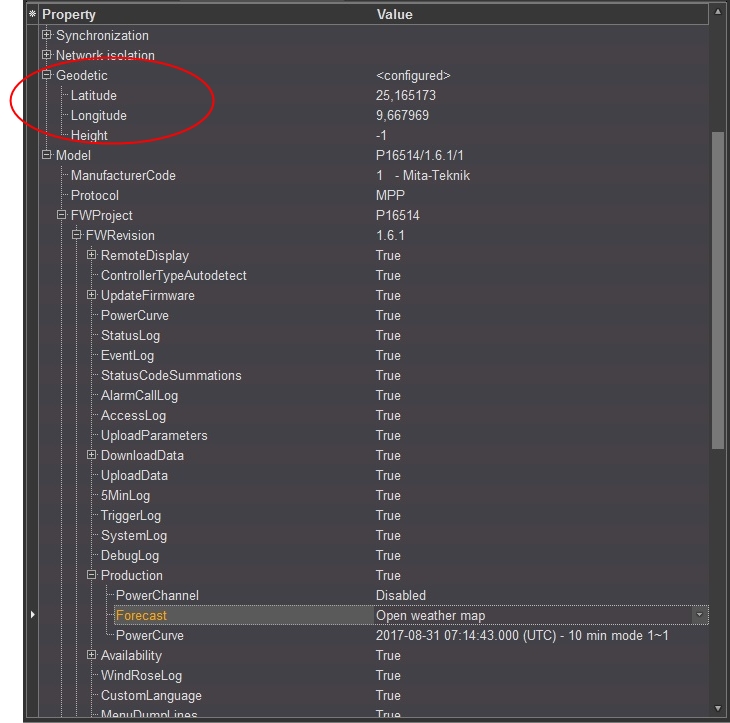
It should be pointed out, that in case SCADA production log is selected, a user has to make sure that the following conditions are fulfilled:
The above information can be vividly demonstrated by the following screen showing controller configuration for the SCADA Log.

Note.If the average period for the SCADA Average Log in data set equals 10 minutes, and in the meantime the Production log is being compiled, an additional production channel will appear in SCADA Average Log.
Data representation will also depend on the time zone prior selected in the Appearance tab.
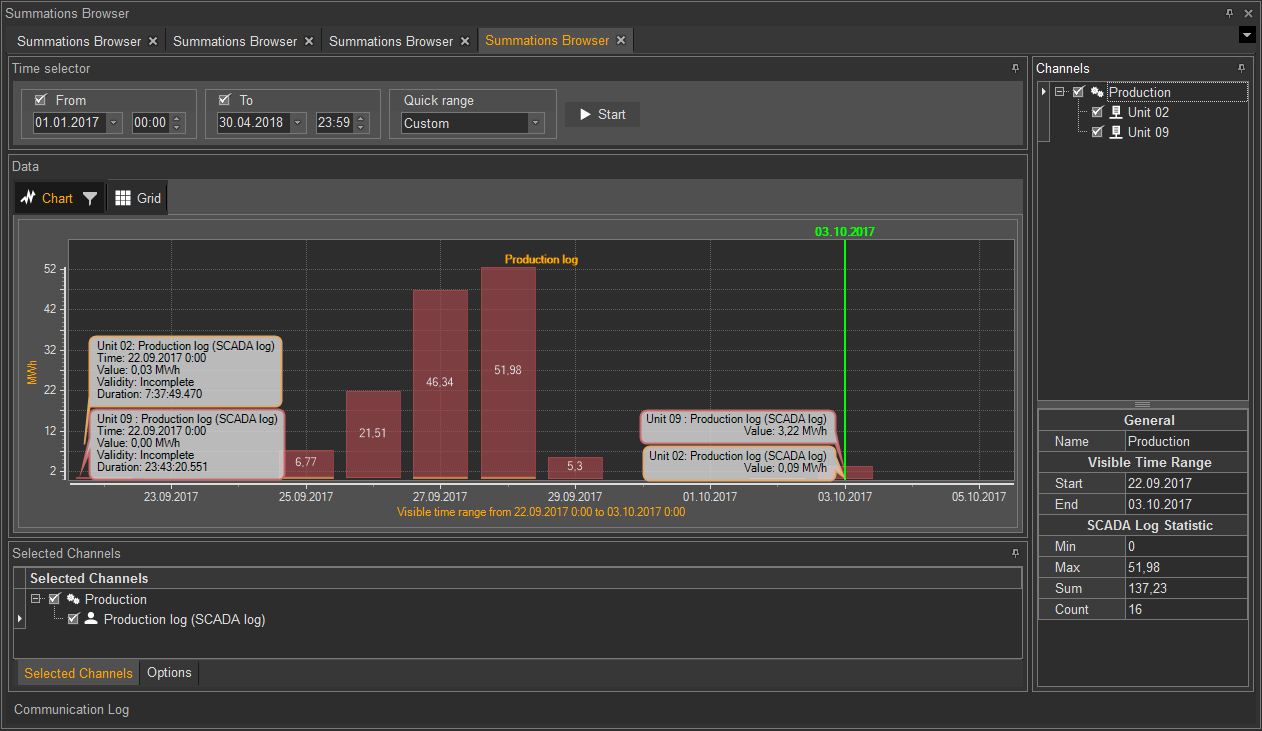
As soon as the Summations Browser window is opened, the Time selector panel is appears within the main monitoring area allowing to make proper time settings for the log data.
State buttons

As soon as the process of prior configuration for the Production Log is finished, press the Start button. This will result in activation of the log generation process, also shown in the Progress bar accessible in the State section on the toolbar as a percentage value. Besides, after pressing Start, the Stop button becomes activated allowing a user to interrupt the process by clicking it.
Eventually, SCADA Production Log appears on the screen as a chart.

Viewing and saving log data as an Excel (.xls) file
For user's convenience, all controller data shown in the log can be viewed and saved as an Excel (.xls) file. For more detail instructions, refer to Viewing and saving log data as an Excel (.xls) file described in Vendor Standard Average Log.
SCADA Production Forecast log shows possible power production for a couple of days in the nearest future for real wind turbines calculated based on weather forecast data by taking into account power curve values.
The workaround for generating SCADA Production Forecast Log is very similar to the one described for Production Log (see Production Log at the beginning of this chapter). However, some preliminary controller configuration is required.
1. Production Forecast must be created and assigned to the properties of the target controller beforehand. For more detail instructions, refer to the Production Forecast chapter.
2. Power curve must be already calculated and assigned to the properties of the target controller beforehand. For more detail instructions, refer to the Power Curve chapter.

For viewing the forecast graph for possible power production take the following steps to generate the SCADA Production Forecast Log.
1. Click the  New icon on the Summations toolbar to open the Summations Browser.
2. Select proper target(s) in the Controller View panel to the left. This will enable the SCADA Production Forecast Log icon on the toolbar.
3. To proceed, press the SCADA Production Forecast Log icon on the toolbar.
As a result, Communication Logtab will appear at the bottom of the Summations Browser window.
There's no need to define the time for the log data in the Time selector panel, as this time period is defined automatically depending on the weather forecast service (see also Production Forecast).
User can also set some additional options on the toolbar effecting the way the log data will be presented on the graph.
4. To launch the log generation process, press the Start icon in the State section on the Summations toolbar. User can trace the progress of the log generation in percentage value shown in the Progress field. Furthermore, it is possible to interrupt the process by clicking the Stop button.
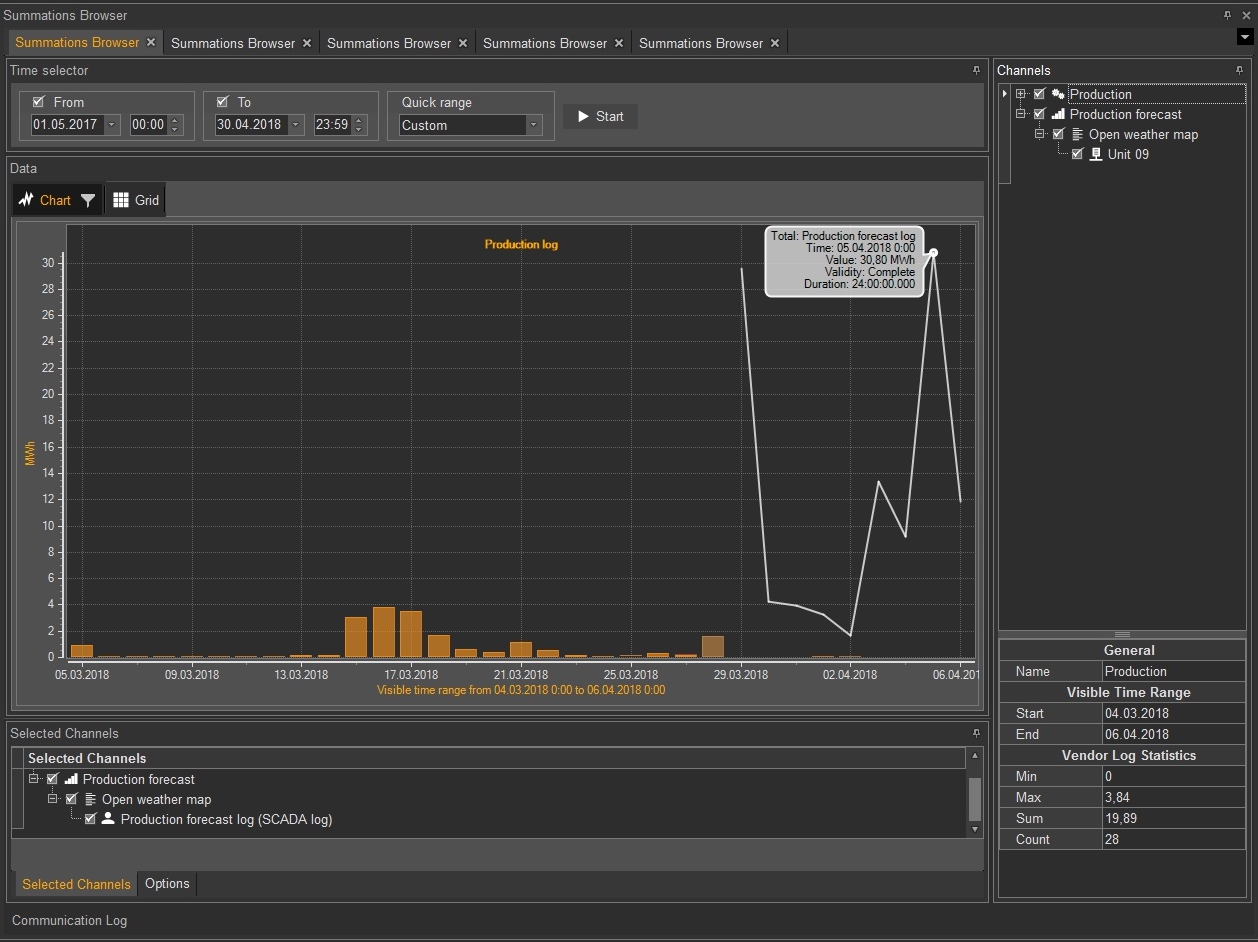
As a result, SCADA Production Forecast Log appears on the screen as a chart. By default, the graph for generated Production Forecast Log can be shown in the Auto mode only as shown in the screen capture below. This means that other options found under the Series draw mode field for onscreen data presentation (e.g. Line, Stairs) are not activated for production forecast log. In the meantime, for production log data Bar is used as the Auto mode for visual presentation of the log data. Therefore, below you can see real production data as compared to the predicted forecast production level.

The logs data can be presented in two modes - Chart and Grid. You can easily switch between the data presentation modes by clicking the corresponding icons.

In the meantime, Chart is used as a default mode. Therefore, as soon as the log is ready, the Data window in the Chart view appears giving a graphical presentation of the log data.
Channels filtering
When in the Grid mode , data of the Production Forecast Log can be filtered in a way to suit best user's needs. This is possible thanks to a variety of filtering possibilities provided for all logs in MiScout SCADA Desk. For more detail instructions on filtering values, refer to Channels filtering described in Vendor Standard Average Log.
Viewing and saving log data as an Excel (.xls) file
For user's convenience, all controller data shown in the log can be viewed and saved as an Excel (.xls) file. For more detail instructions, refer to Viewing and saving log data as an Excel (.xls) file described in Vendor Standard Average Log.