

|
SCADA Log Monitor enables monitoring of wind turbine parameters in the real-time mode, thus helping users in setting up and optimizing the unit components.
With the help of SCADA Log Monitor users are provided with instant access to data, thus staying informed about how the turbine responds to all external and internal conditions and influences. Such approach ensures that data is being continuously received from the controller and data for the last five-minute's period is presented on the SCADA Log Monitor chart.
In MiScout Desk, SCADA Log Monitor is accessible under the SCADA Log Monitor tab on the main application ribbon. Therefore, first make sure, that the SCADA Log Monitor (mtplSCADALogMonitor.bpl) plug-in is already listed in the Plugin Configuration dialog.
If the required plug-in is available, the SCADA Log Monitor tab will appear on the main application ribbon. In case the required plug-in is not on the list, you can easily upload it. For more detail information, refer to Configuring Plug-ins.
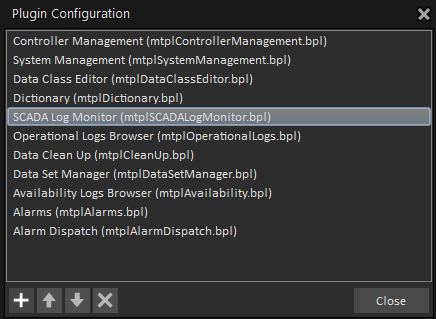
As soon as the plug-in is loaded to Plugin Configuration, the SCADA Log Monitor tab appears on the main application ribbon.
For a user to be able to view the chart data, the following workaround must be taken step by step.
1. Click the SCADA Log Monitor tab on the application ribbon to open the corresponding toolbar.

2. Afterwards, press the New icon on the toolbar and select the required unit by clicking its check-box in the Controller View panel to the left
As a result, the SCADA Log Monitor window will reveal within the main monitoring area.
3. In the Channels panel to the right select the required channels by clicking their check-boxes.
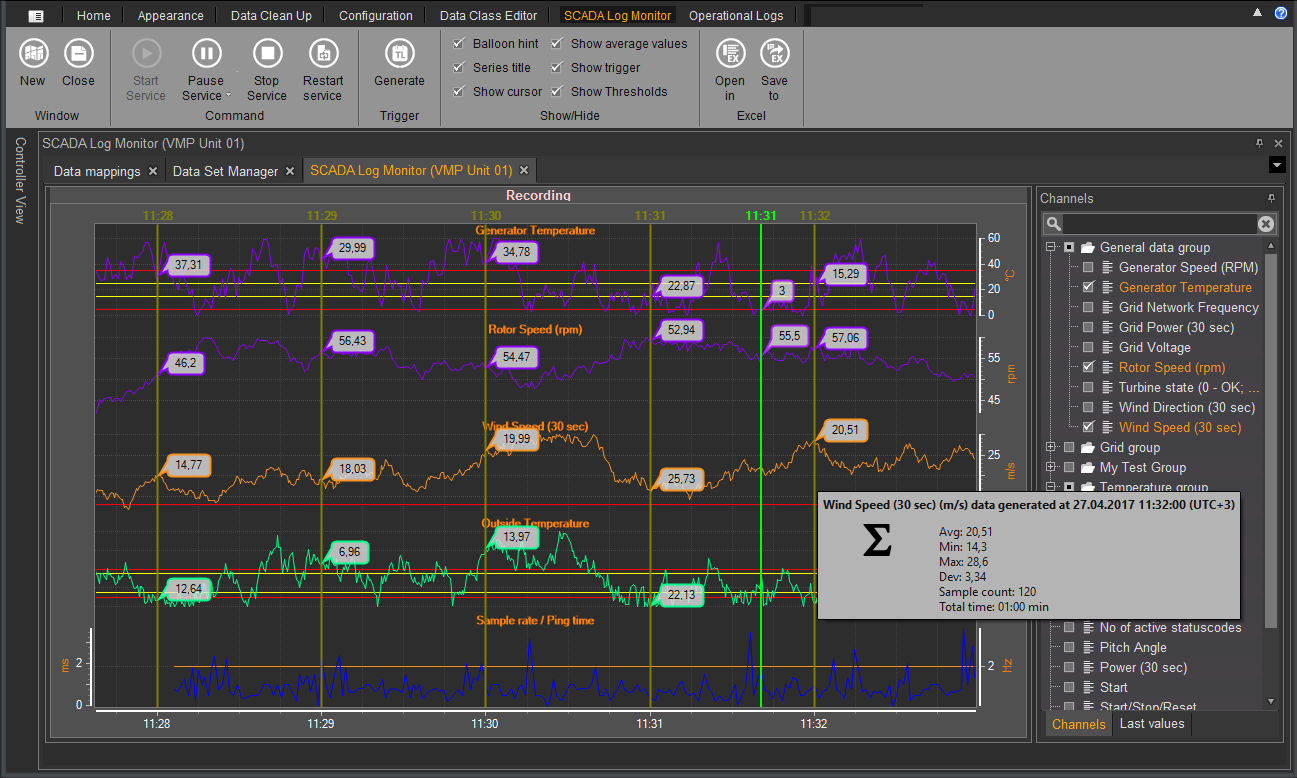
User is free to make any selection among available channels in the Channels panel to the right of the main application window.
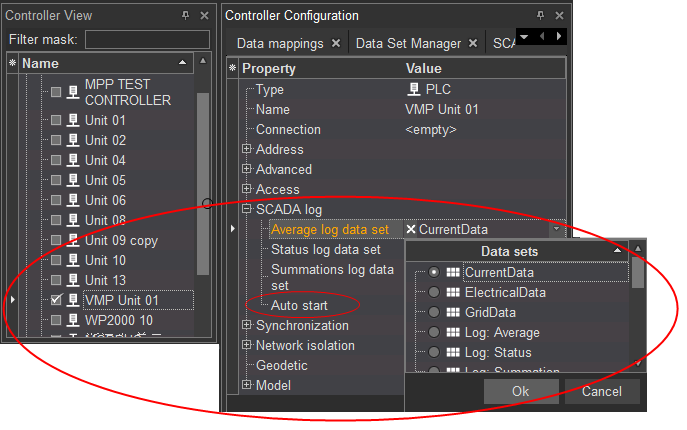
Note. The list of available channels corresponds to the data set prior assigned to the controller property Average log data set. This property resides in the Controller Configuration window and can be accessed on revealing the SCADA Log node. For more information, see the Controller Configuration subsection.
4. Finally, to launch the process of data streaming, click the Start Service icon to see continuous data streaming.
When the data is being received, the Pause Service and Stop Service icons become activated (see the screen with the SCADA Log toolbar in Step 1 earlier in this section). Therefore, using the menu options under the Pause service icon, the SCADA Log service can be paused for the following time periods:
In case the SCADA log service has been paused, the data will be still received in the background; however the chart will not be updated. Such approach allows users to analyze and compare the received data.
However, if the service has been stopped, no data will be received. Therefore, press the Restart Service icon to resume the data receiving process. Thus, all data collected in the background will appear on the chart and further on the data will continue to be received.
Note. On setting the controller property Auto start to True (accessible under the SCADA Log node), continuous data streaming service starts automatically.
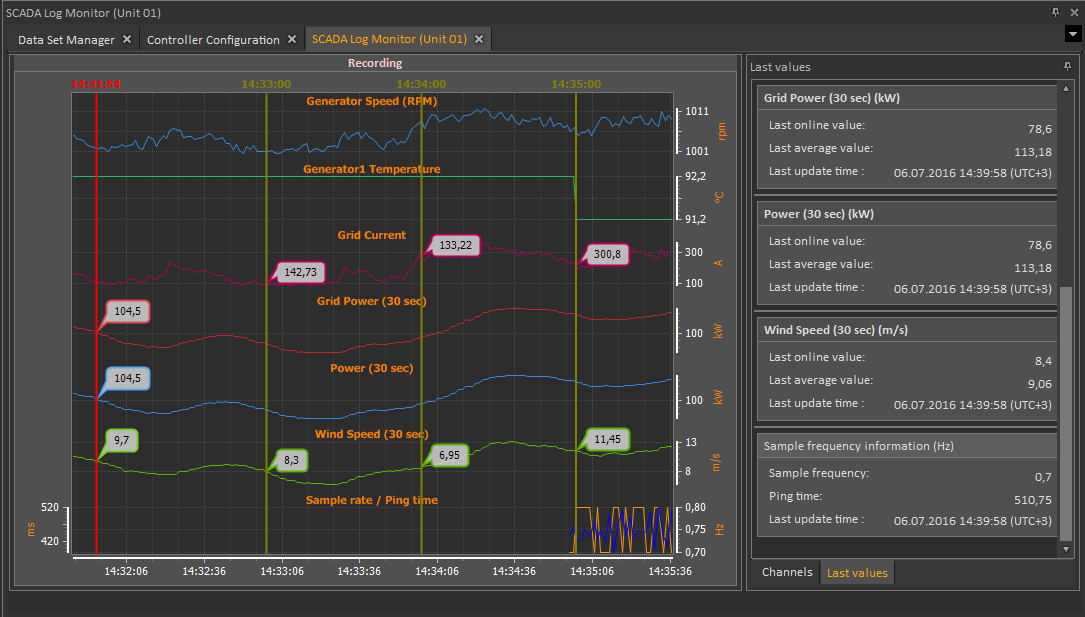
On clicking the Last values tab at the bottom of the Channels panel, you will get access to information about the last update time of received values for the selected data items.
Note. Channel lower/upper values to specify the threshold range must be preliminary configured in data mapping. For more information, see custom mapping in the Data Class Editor section.
Configuring channels
With the help of New and Delete icons available in the Channels section on the toolbar a user is able to add or remove channels in the SCADA Log Monitor window.
Important Note. For successful channels configuration, make sure first, that an appropriate data set is already assigned to the target controller with at least one data item inside. For more information, see Data Sets Setup chapter.
For example, to add a new channel, press the New icon on the toolbar. Alternatively, right-click within the Channels panel to the right and select the New option in the context-menu. This will make the Edit data item dialog appear within the main monitoring area allowing you to configure the following General properties of the channel:
On configuring the above properties, press the OK button in the dialog.
As a result, the new channel will appear in the Channels panel to the right of the main SCADA Log Monitor window. The recently added channel is marked with a green plus icon, therefore, click the Commit Changes icon to have it saved. On saving the channel, select the check-box next to it to activate it and have corresponding data appear on the screen.
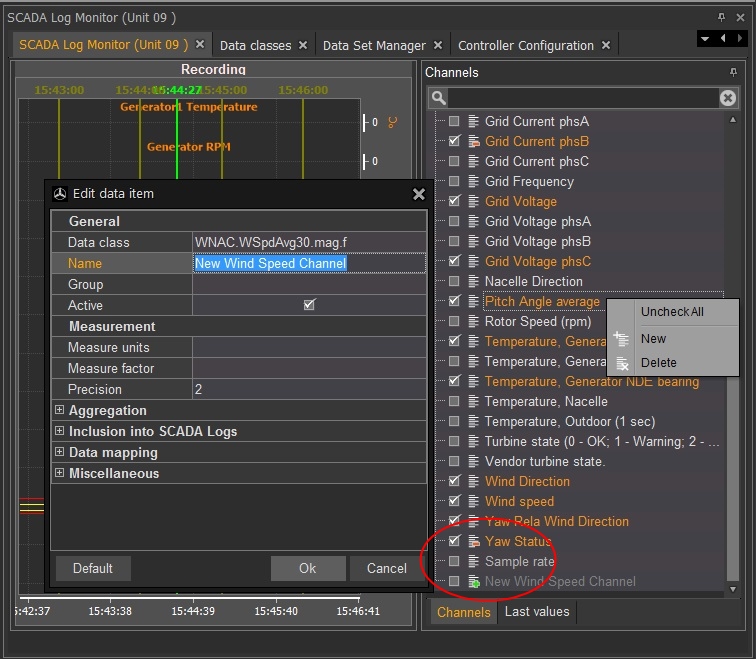
In case some channels are extra, you can easily remove them from the SCADA Log Monitor. To do this, click the required channel and press the Delete icon on the toolbar or use the same option available in the right-click context-menu. As a result, the channel meant for removing will be marked with the red minus icon. To completely delete the item, press the he Commit Changes icon at the left top of the main application window. If successful, the removed channel will no longer be listed among the channels in the Channels panel to the right of the SCADA Log Monitor main window.
Generating a manual trigger
In the Trigger section of the SCADA Log Monitor main toolbar resides the  Generate button. With the help of this button a user is able to manually activate SCADA Trigger Log generation. For more information, see the manual section called Trigger Log.
Note. Prior to generating a Trigger Log, thresholds must be already pre-configured. For more information on configuring thresholds, see Configuring Thresholds for SCADA Logs Monitoring.
On pressing the Generate button in the Trigger section of the toolbar, a red vertical line will become visible on the SCADA Log Monitor chart.
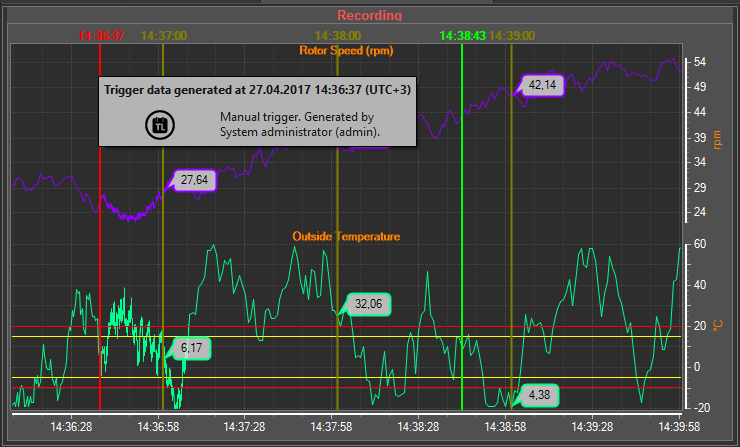
Hover the mouse curser over the red vertical line to make a special information box appear on the screen stating who the manual trigger was generated by as well as its generation timestamp.
By default, for Trigger Log generation, data are collected over the definite time period. This default time period normally starts at 60 seconds before the trigger should fire and lasts for the following 30 seconds after its fire time. However, you can easily change this default time span in the Data Set Setup dialog available in the Data Set Manager.
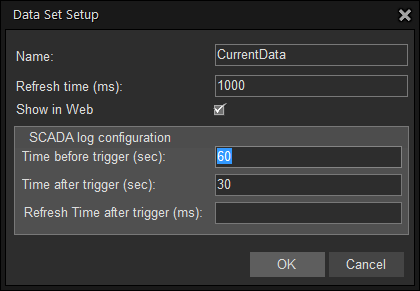
The screen above represents the Data Set Setup configuration dialog allowing you to configure the data set parameters as well as set the default trigger time for SCADA Log Monitor:
SCADA log configuration
For more information, see Data Set Manager in the Data Sets Setup section.
Viewing and saving log data as an Excel (.xls) file
For user's convenience, all controller data shown in the SCADA Log Monitor chart can be viewed and saved as an Excel (.xls) file. This can be done with the help of the ![]() Open in and Save to
Open in and Save to ![]() icons residing in the Excel section of the main toolbar.
icons residing in the Excel section of the main toolbar.
Therefore, upon clicking ![]() , the log data will appear in the revealed Excel file (.xls).
, the log data will appear in the revealed Excel file (.xls).
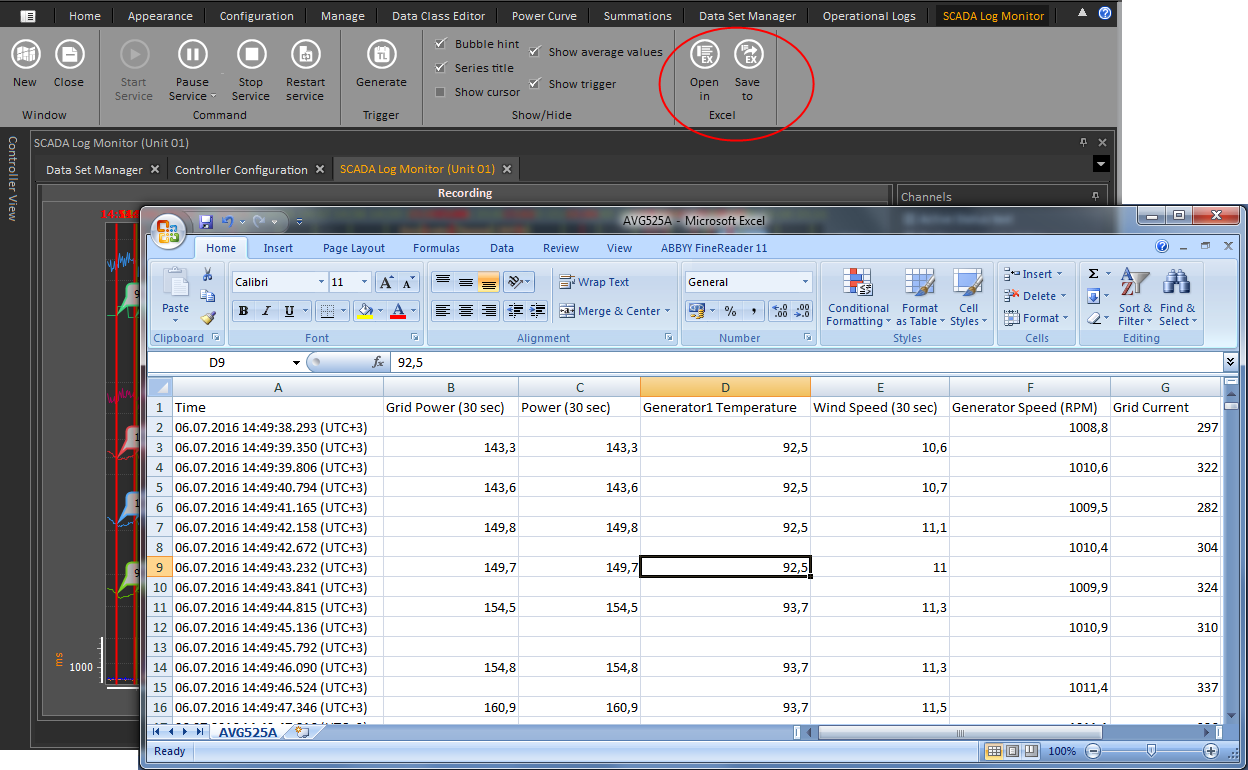
Please note, that on clicking the ![]() Open in icon, the revealed Excel file (.xls) is available for viewing only. By default, this file is saved to the temporary directory, so that it won't be available after a user has logged out.
Open in icon, the revealed Excel file (.xls) is available for viewing only. By default, this file is saved to the temporary directory, so that it won't be available after a user has logged out.
To be able to use the excel file after logging out from ![]() icon to save the file for further use. As a result, the Save As dialog appears on the screen allowing to select the destination folder, into which the Excel file will be stored.
icon to save the file for further use. As a result, the Save As dialog appears on the screen allowing to select the destination folder, into which the Excel file will be stored.
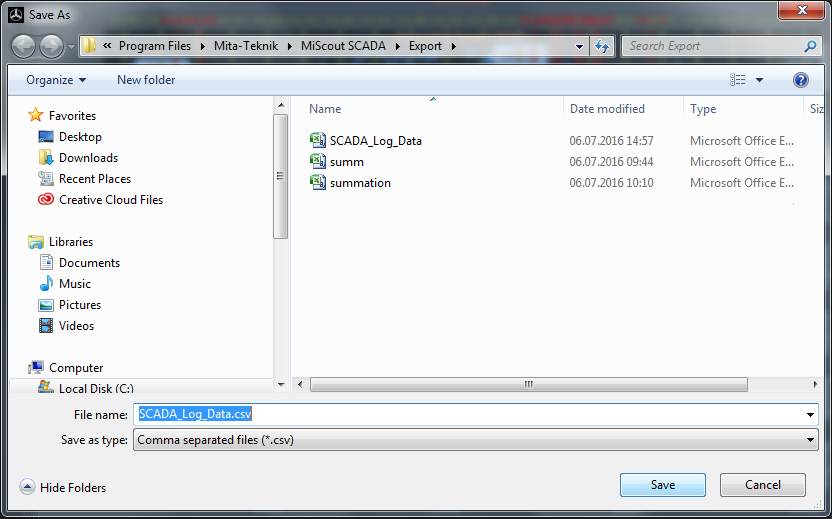
In the File name field: specify the name for the .xls file and select Comma separated files (.csv) in the Save as type: field. Finally, press the Save button to finalize the configuration process. If done successfully, the newly created Excel file will be available in the corresponding directory.